The $48 Fix: Reclaiming California’s Master Plan for Higher Education
(A PDF of this report — prettier than this web version and suitable for printing — is available. A spreadsheet with all the data and charts in this report is also available.)
California’s commitment to its world-acclaimed system of public higher education has declined dramatically since 2000, at tremendous loss to California’s people, economy and future prospects.
It’s not too late. There are solutions.
■ It is commonly, but mistakenly, presumed that returning to California’s Master Plan for Higher Education would cost too much, putting the best solution out of political reach.
■ This presumption has led to policy changes and recommendations for the future which, if adopted, will only speed the deterioration of California’s higher education system.
■ The fact is, better options—reasonable, do-able and affordable—are available to practical-minded leaders of today. The funding can be found right here in California.
The Master Plan, California’s proven model
In 1960, California Governor Pat Brown and lawmakers created the Master Plan for Higher Education and rationalized its three-segment system:
■ University of California | Undergraduate, graduate, research and professional education; open to top one-eighth of high school graduates
■ California State University | Undergraduate and graduate education through the master’s degree in professional and teacher education; open to top one-third of high school graduates
■ California Community Colleges | Academic and vocational instruction through the first two years of undergraduate education; open to all, with transfer routes to the four-year universities.
■ This system was highly successful. It accommodated Baby Boom students in the world’s best public universities, efficiently delivering opportunity and upward mobility to young Californians and their families.
The state takes a disastrous detour into privatization
The 1960 Master Plan treated education as a public good, provided at low-cost or no-cost to all California students, yielding a wider social and economic benefit. But since 2000, higher education has been treated as a commodity to be sold to consumers for their private gain.
■ Between 2001 and 2016, $57 billion (in real dollars) has been withheld from California’s public higher education sector. By 2016, the state was spending 39 percent less per university student than fifteen years before.
■ At the same time, the three segments increased student charges dramatically. Tuition and mandatory fees have risen nearly 150 percent at UC and nearly 170 percent at the CSU. They have more than tripled at community colleges.
■ Coincident with the state’s privatization experiment, student debt at California’s public universities has exploded. In 2015, more than half of UC and CSU seniors graduated with more than a diploma: they also carried $1.3 billion in student debt. Total debt accumulated by the state’s public university students since 2004: $12 billion.
■ The damage has been system-wide. Classes are impacted. Qualified students are turned away or unable to afford the public higher education that two previous generations took for granted. Research and instruction suffer. Trying to make up for state cuts, universities engage in damaging behaviors that threaten their core mission, such as private fundraising and signing up out-of-state students simply for the tuition revenue they generate.
■ Premised on the presumption that California—objectively richer than ever—has no will to restore the higher education system that made that prosperity possible, experts propose “efficiency” campaigns to cope with scarcity. Sadly, educational quality is too often left out of the equation.
People suffer when a system fails
■ California students and their families are paying more and getting less. Beyond the generational losses, California is now failing to produce enough college-educated citizens to support its economic future.
■ Indeed, if the state deliberately set out to implement a policy to deny its people opportunity and make sure California is a loser in national and global competition, privatizing higher education does the job.
Reclaim the model that serves all Californians
■ California voters feel California’s public higher education system is central to the state’s quality of life and its economic vitality. They set restoring top-quality, affordable higher education ahead of other state priorities, including high-speed rail, water projects, and rebuilding roads and bridges.
■ It turns out that keeping the full promise of the Master Plan—returning the state’s investment per CSU and UC student to 2000 levels (inflation- adjusted); eliminating tuition and fees for all in-state UC, CSU and CCC students; and funding seats for qualified California high-school graduates now refused access to the system—is affordable.
■ Reclaim seats for in-state students | With the Master Plan restored, California higher education would no longer feel compelled to seek to cover funding gaps with non-resident tuition. As a result, out-of-state undergraduate enrollments could return to historic levels.
■ Re-emphasize the public service mission | Overall policy must de- emphasize private fundraising that distorts or neglects research in the public interest. Restoring the Master Plan would allow higher education administrators to be paid as public servants administering public funds rather than as “developers” pursuing private money.
■ Make a reasonable financial commitment | To fully fund projected enrollment and eliminate tuition in all three segments of California’s public higher education system will cost $9.43 billion in 2016-17. It can be covered through an annual income-tax surcharge that will:
■ Cost median-income California families $48 a year;
■ Cost two-thirds of state households less than $150 a year;
■ Cost households in the top 5 percent about $7,100 (more for multi-millionaires).
■ Add other financing options | If California, like other states, adopted an estate tax and an oil severance tax, those could cover about a quarter of the entire cost of restoring the Master Plan, reducing the median household’s cost to $36.
Conclusion
■ The privatization experiment has failed. The harm to a generation of hard-working, high-aiming young people is proven. It’s time to return to what works: the proven Master Plan for higher education in California. California, with its own resources, can afford to restore top-quality, accessible, affordable college and university opportunity to every qualified student. In fact, Californians can afford nothing less.
Privatization isn’t the solution. It’s the problem.
Privatization—treating higher education as a commodity that students and their families buy rather than as a public good provided to everyone who would benefit from higher education—has led to more student debt
and less access. Political leaders in both parties are increasingly persuaded that the cost of higher education is a societal responsibility.1
In practical terms, the failed privatization strategy has drastically cut public support to California higher education and shifted the cost to individual students and their families. Indeed, California now invests less money in each college student than it spends on each K-12 student.2
At the California State University (CSU) and the University of California (UC), this shift has meant exploding tuition demands. Large as these increases have been, they have not been enough to maintain quality.
Self-proclaimed higher education reformers (and some higher education administrators) have sought to deal with cuts by increasing “efficiency,” while ignoring declines in the quality of the education delivered.
In California’s Community Colleges (CCC), reduced capacity has diverted thousands of students to exploitative for-profit “universities” that leave students indebted but with little educational benefit.3 Across California’s public higher education system, students are paying more to get less.
Privatization has also seen skyrocketing administrative salaries and rising enrollment of out-of-state undergraduates, who pay three times as much tuition as California residents. While out-of-state students diversify California campuses, they are being enrolled primarily to fill funding gaps that result from privatization, not to enrich the educational environment.
Restoring the promise of higher education in California would mean the systems would no longer need to paper over funding gaps with non-resident tuition and could roll back out-of-state enrollment to historical levels.
Reversing privatization would also free higher education leaders from constant private fundraising; they could again be held to the standards of public stewards, not commissioned development specialists.
Sending a generation downward, not upward
California’s Master Plan for Higher Education,4 which served the state for generations, has been thrown into reverse. Rather than offering a meritocratic ladder of opportunity that California students can ascend by hard work, today students qualified for a UC are displaced to a CSU; students displaced from CSU must turn to the community colleges; and students displaced from the community colleges are forced into the for-profit “university” sector.
Budget cuts since 2000—especially severe during the recession years— have compromised the capacity of all three segments to advance students through needed classes, increasing the time (and money) it takes to graduate.5 Five-and six-year undergraduate degrees are denounced as a failure of the educational establishment or as the students’ fault. In fact, the explanation is simpler and more obvious: privatization has left the system unable to meet student demand.
Voter support for public higher education remains strong
The people of California appreciate the value of the state’s system of public higher education. A March 2016 poll by the Public Policy Institute of California (PPIC) found that 80 percent of Californians ranked public higher education as “very important,” ahead of water issues and high speed rail.
A December 2016 PPIC survey6 found that 77 percent of adults felt that California’s higher education system was very important to California’s quality of life and economic vitality.
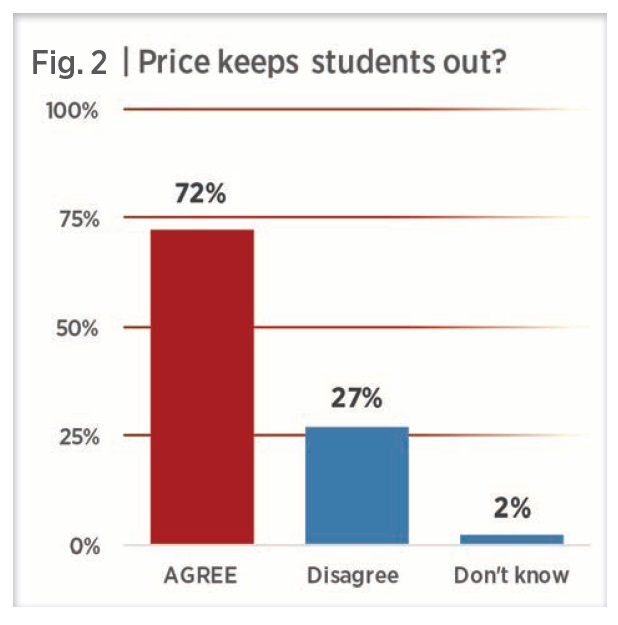
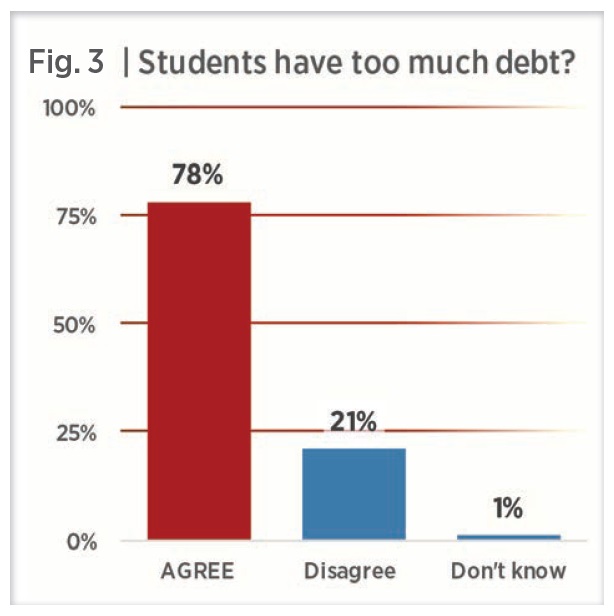
Strong majorities said current state funding for public colleges and universities was not enough, agreed high tuitions kept motivated students out of college, and worried about student debt (Figs. 1-3).

Public Policy Institute of California. Californians and higher education: December 2016.
Public Policy Institute of California. Californians and higher education: December 2016.
Public Policy Institute of California. Californians and higher education: December 2016.
The December 2016 poll also showed that three-quarters of Californians favor more government funding to eliminate community college fees. More than 80 percent want government funding for scholarships and grants increased for students attending four-year schools (a tuition-free model was not tested). Two-thirds said they would vote for a state bond to fund higher education construction projects.
PPIC also asked likely voters about raising taxes to boost higher education funding. With the size of the increase left to respondents’ imaginations, results were about evenly split.
Building on proven success to ensure California’s future
It is commonly presumed that returning to California’s Master Plan for Higher Education would cost too much, putting the best solution out of political reach. This presumption has led to policy changes and recommendations for the future which, if adopted, will speed the deterioration of California’s higher education system. This presumption is not correct.
When the Master Plan was adequately funded, it worked. Adequately funded, it will work again. Ignoring decades of pragmatic experience, state policymakers—and some of the institutions themselves—have pursued remedies that make privatization worse.
Besides expanding out-of-state undergraduate enrollment, these nostrums include promoting inappropriate use of online instruction, allowing private interests to set academic priorities de facto, and pushing community colleges to abandon their traditional role in lifelong learning in favor of offering narrowly technical baccalaureates of questionable utility.
Reclaiming the Master Plan for all three of California’s higher education segments would close California’s economically dangerous degree gap.7 Doing so would also return the public interest to its rightful place as the central mission of university research.
It is time to undo the damage done by the failed privatization experiment.
California policymakers have replaced taxpayer funding with student debt, degraded educational quality and restricted access.
This can be undone by restoring a model with a proven track record spanning generations: delivering on the promise of tuition-free, top-quality, accessible public higher education.
Tuition-free, top-quality, accessible higher education is possible
By returning CSU and UC per-student funding to where it was in 2000 (adjusted for inflation) and eliminating tuition and CCC student fees altogether, California can restore quality and access to California’s three higher education segments as defined in the 1960 Master Plan for Higher Education.
Doing so would guarantee seats for all qualified students at a surprisingly low cost to Californians: $48 in additional income tax for the median household.8
Eliminating tuition would eliminate almost all new student debt.
From 2004 to 2015, student debt carried by senior classes graduating from California’s public higher education ballooned by two-thirds, in real dollars, from $803 million to more then $1.3 billion (2015 $). The annual amount carried by CSU graduates more than doubled in these years, from $351 million to $779 million, while UC seniors’ debt grew by 21 percent (Figs. 4, 5). Altogether, over those twelve years, a quarter-million graduates from California’s 4-year universities took on $12 billion in student debt (Fig. 6).
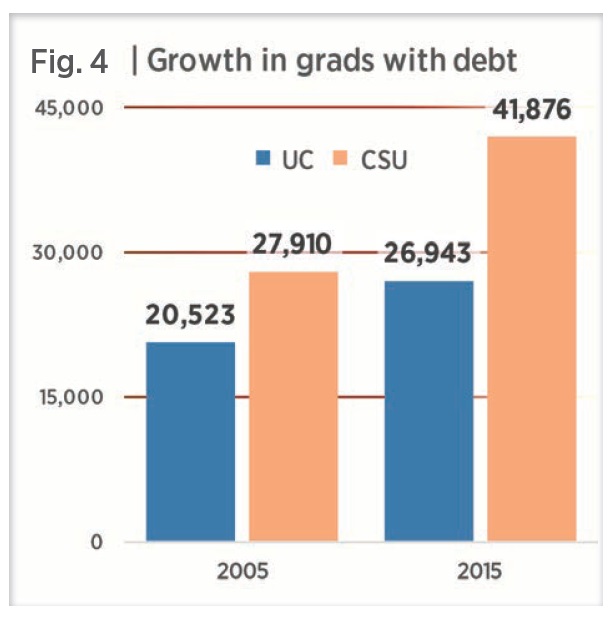
ESCALATION | Between 2005 and 2015, the percentage of graduating seniors with debt at the UC climbed from 50 to 55%, at the CSU from 42% to 51%.
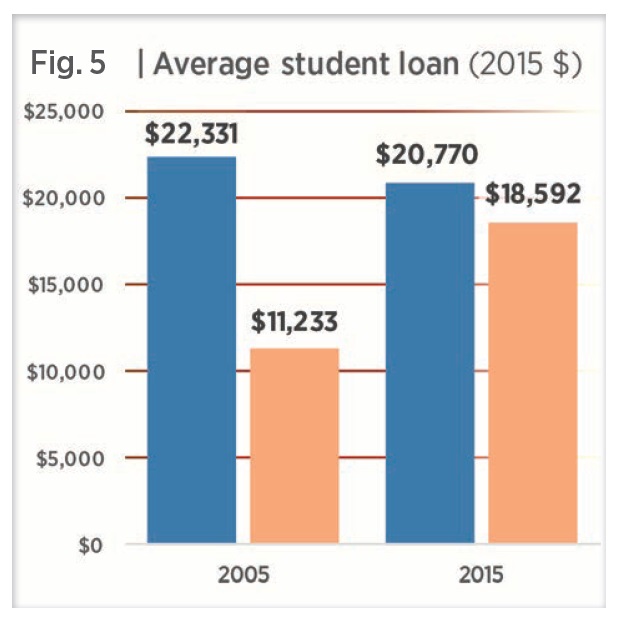
CATCHING UP | In 2005, the average debt load for a CSU graduate with student loans was half that of a UC grad. By 2015, a CSU graduate with debt owed nearly 90 percent as much as the UC graduate.
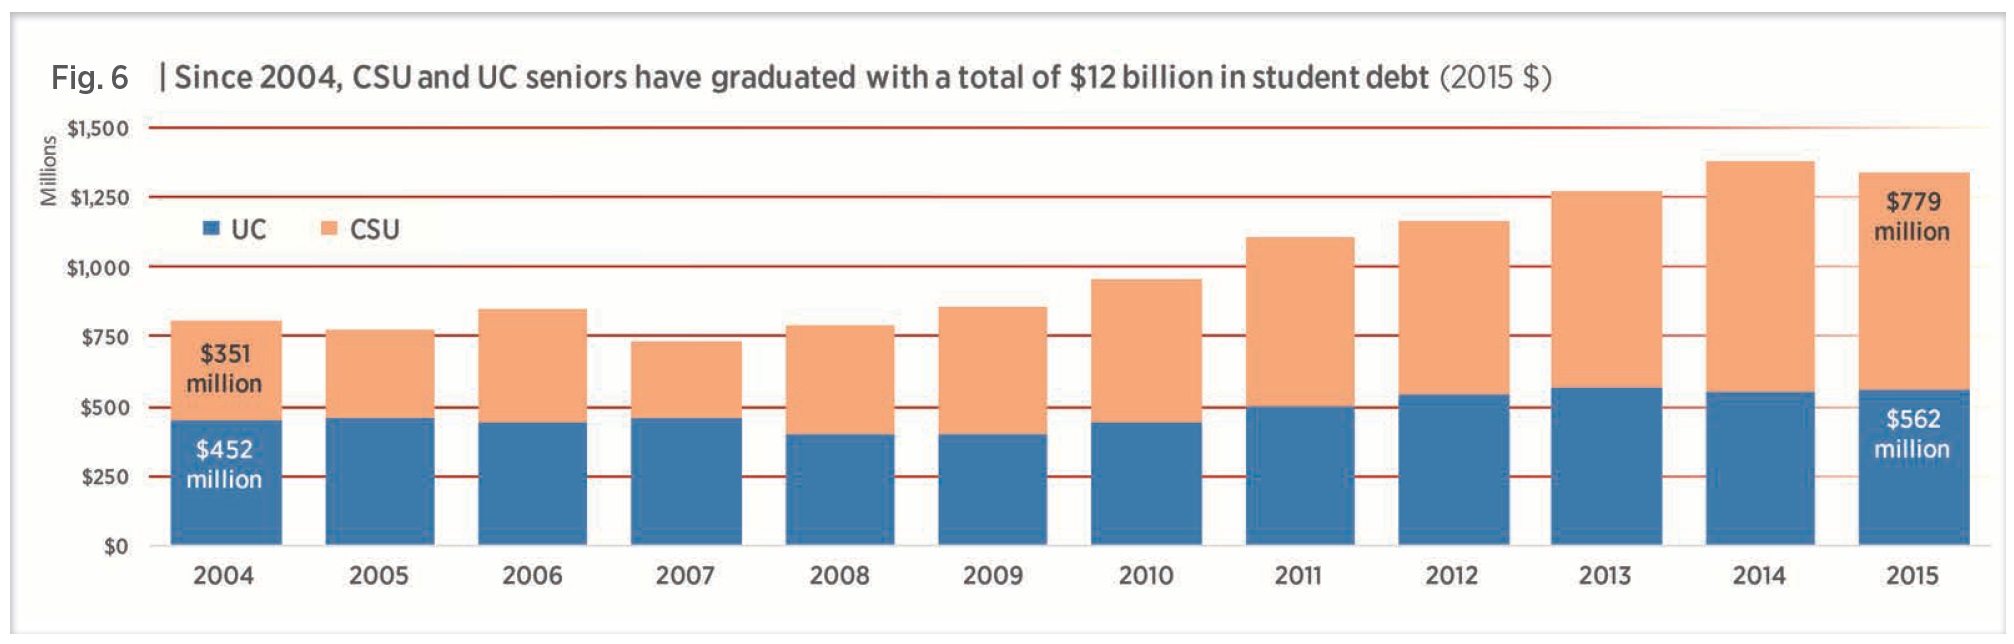
SOURCES | Figs 4-6: Calculated on data from UCOP and The Institute for College Access & Success (TICAS). Reported CCC debt comprised about 1% of total CA public higher ed student debt; data unavailable on loans taken by students diverted from the CCC to for-profit schools in this period.
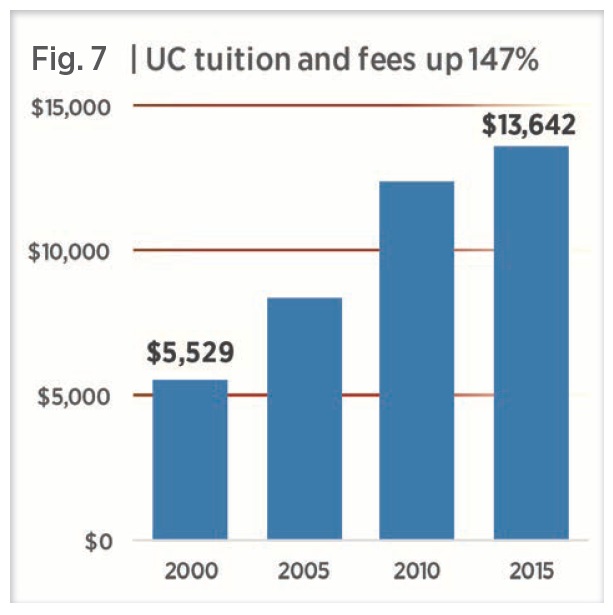
University of California costs | At UC, 55 percent of seniors now graduate with an average of $20,770 in student loans; five percent graduate more than $32,600 in debt.9 Tuition is only one part of the total cost to attend college. A 2016 survey of UC students found that “about one-fourth said they had to choose between paying for food or educational and housing expenses.”10 But eliminating tuition that has more than doubled since 2000 (Fig. 7) would save UC undergraduates and their families some $13,500 per year—more than $50,000 over four years.
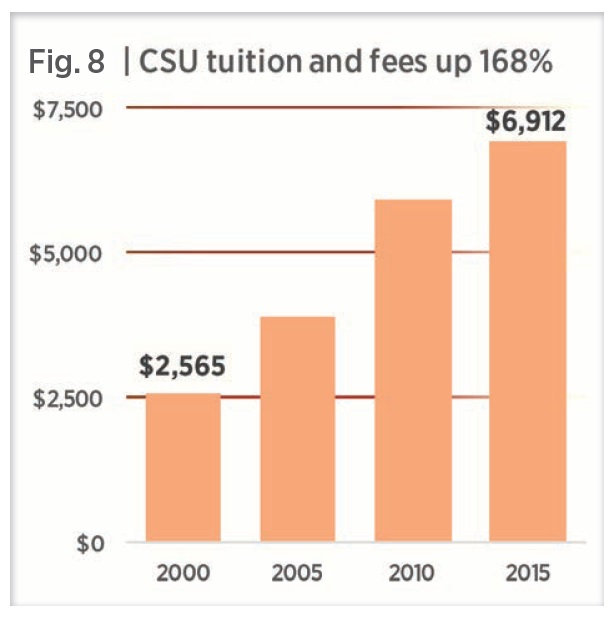
California State University costs | Undergraduate student tuition and fees in the CSU totaled $6,881 in 2016, a 168 percent increase from the year 2000 (Fig. 8). This increase most heavily affects the large proportion of students from lower- income backgrounds and self-supporting students typically served by the CSU.
In 2015, nearly 42,000 CSU seniors with student loans carried more than three-quarters of a billion dollars in debt when they picked up their diplomas (2015 $). Significantly, a 2016 study found that about 10 percent of the CSU’s half million students are homeless and about 20 percent are hungry. These findings suggest that tuition forces the most price-sensitive students to choose between education costs and living costs.11
Viewed in terms of working hours, in the year 2000 a CSU student or family member had to work nine hours each week at minimum wage to cover a year’s tuition and fees. By 2016, she or he needed to work nineteen hours per week to cover these charges,12 jeopardizing educational outcomes—especially among students from low-income communities who may already start from a disadvantaged place.13
Community college fees | Before 1984, the CCC charged no fees. Unlike UC and CSU, the CCC budget is determined by Prop 98. During the economic troubles of the 1990s and early 2000s, the CCC saw its share of Prop 98 funding reduced in the interest of serving the large population bubble making its way through the K-12 system. Political leaders imposed a fee increase on community college students, effectively a tax imposed on students.
Students were being asked to pay more for less as budget cuts reduced the number of classes offered. Making matters worse, in a troubled economy, unemployed young people tend to turn to the community colleges to expand their skills. Access was reduced just when demand spiked.
Sadly, while California’s recovery has meant greater revenue from Propositions 98 and 30, restoring funds to both K-12 and the CCC, the Master Plan has been ignored. There has been no discussion of rolling back community college student fees, which have tripled since 2000 (Fig. 9).
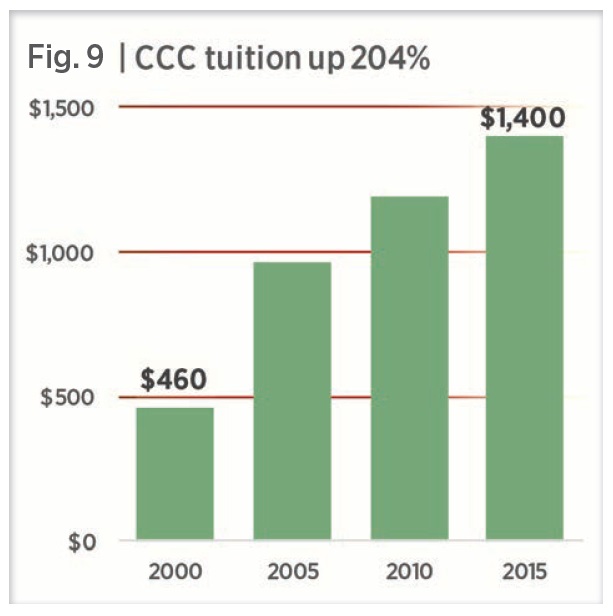
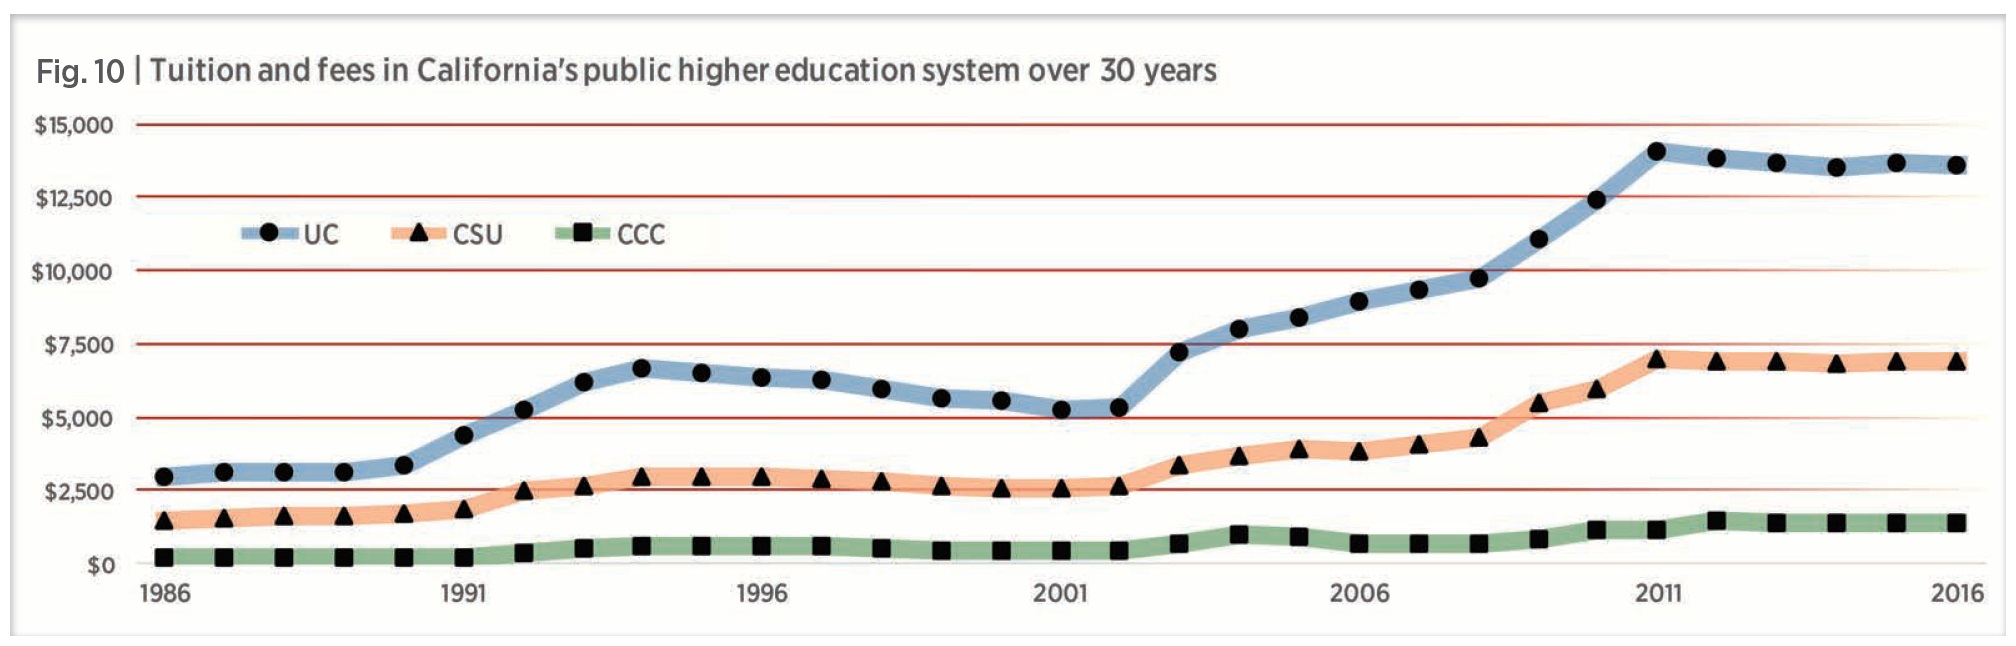
SOURCES | Figs. 7, 10: UCOP (Appendix Display 10). Figs. 8, 10: CSU Budget Office (before 2010, after 2010). Figs. 9, 10: CCC Chancellor’s Office.
At $46 per semester unit, community college fees might look like a bargain, compared to CSU and UC. Yet community college students often come from populations with few financial resources and are confronted with complex financial aid requirements. Families are easily intimidated by the sticker shock of having to meet both ordinary living expenses and student fees of nearly $1,400—four times what community college cost in 1986, in real dollars.
Brain drain: Since 2000, California has cut public investment in the state’s highest-aiming students by 39 percent.
Since 2001, California has withheld a total of $57 billion from public higher education.14 In 2016, the state was spending 39 percent less per full-time equivalent (FTE) CSU and UC student than fifteen years before. Tuition increases have made up some of these cuts. But not all. The cuts have also reduced course offerings and impacted classes, making it more difficult to complete undergraduate requirements in the four years once considered routine—and also substantially more costly for students to graduate in five years.
Policymakers and the general public worry about the value of a college degree. Attention has been lavished on a narrow version of this concern: Do students get a good return on college in the form of a well-paying job? But focusing on the private market value misses two-thirds of the value of public higher education.15 This report asks a broader question with more significance for California and the wider society: Are students acquiring “higher learning” with profound public as well as private utility?
Public colleges and universities need to regain broader understanding of their public mission—and endow students with higher-order cognitive capabilities for 21st Century jobs that cannot be easily automated or outsourced. Doing so requires things now in short supply at public colleges, such as small- group contexts for intense, individualized, research-based forms of instruction.
California can quickly reverse the damage done by privatization by restoring the Master Plan for Higher Education. In contrast to recent policy studies that call for more dilution of the Master Plan, reclaiming the Master Plan can fix the problems of the current system and serve as a model for higher education reform across the country.16
A state of educational decline
The need for increased degree attainment has been clear for many years. By the early 2000s, the National Information Center for Higher Education Policy- making and Analysis was projecting degree production in relation to demographic changes in the state’s population, and showing likely declines (Fig. 15).17
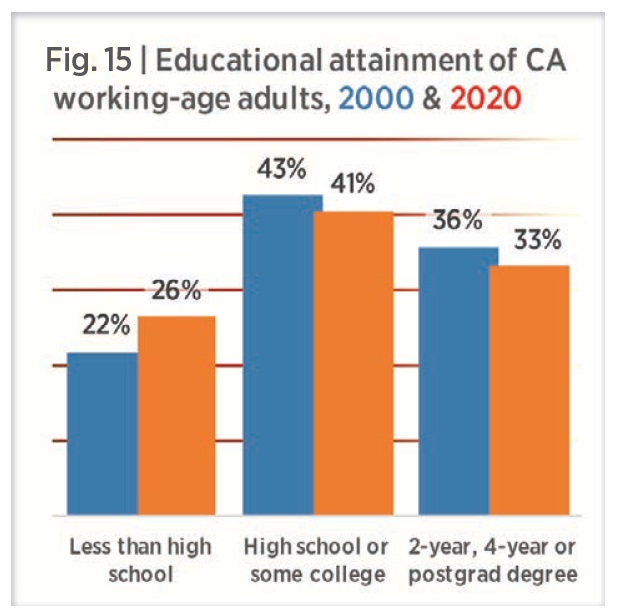
WRONG DIRECTON | At present rates, by 2020 California’s working-age adults (25-64) will be less likely to have finished high school and there will be relatively fewer Californians with bachelor’s or advanced degrees—completely contrary to trends in workforce demand. (Source: NICHEPA)
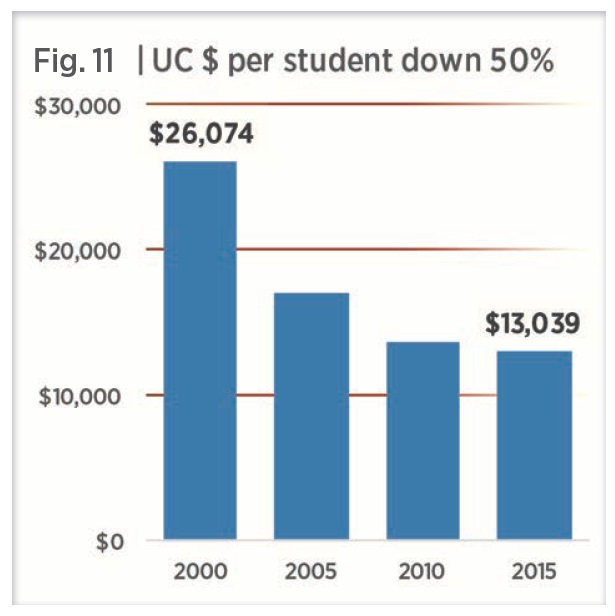
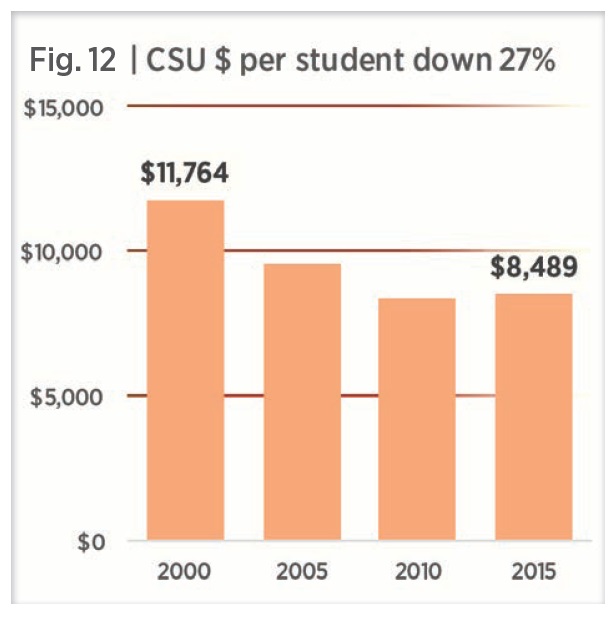
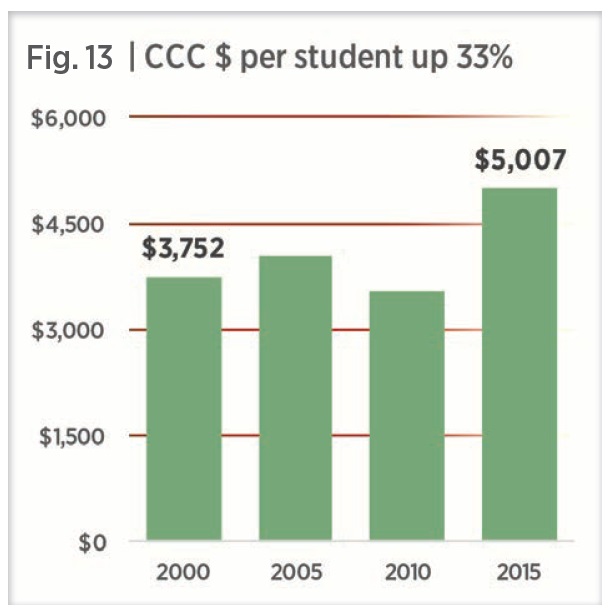
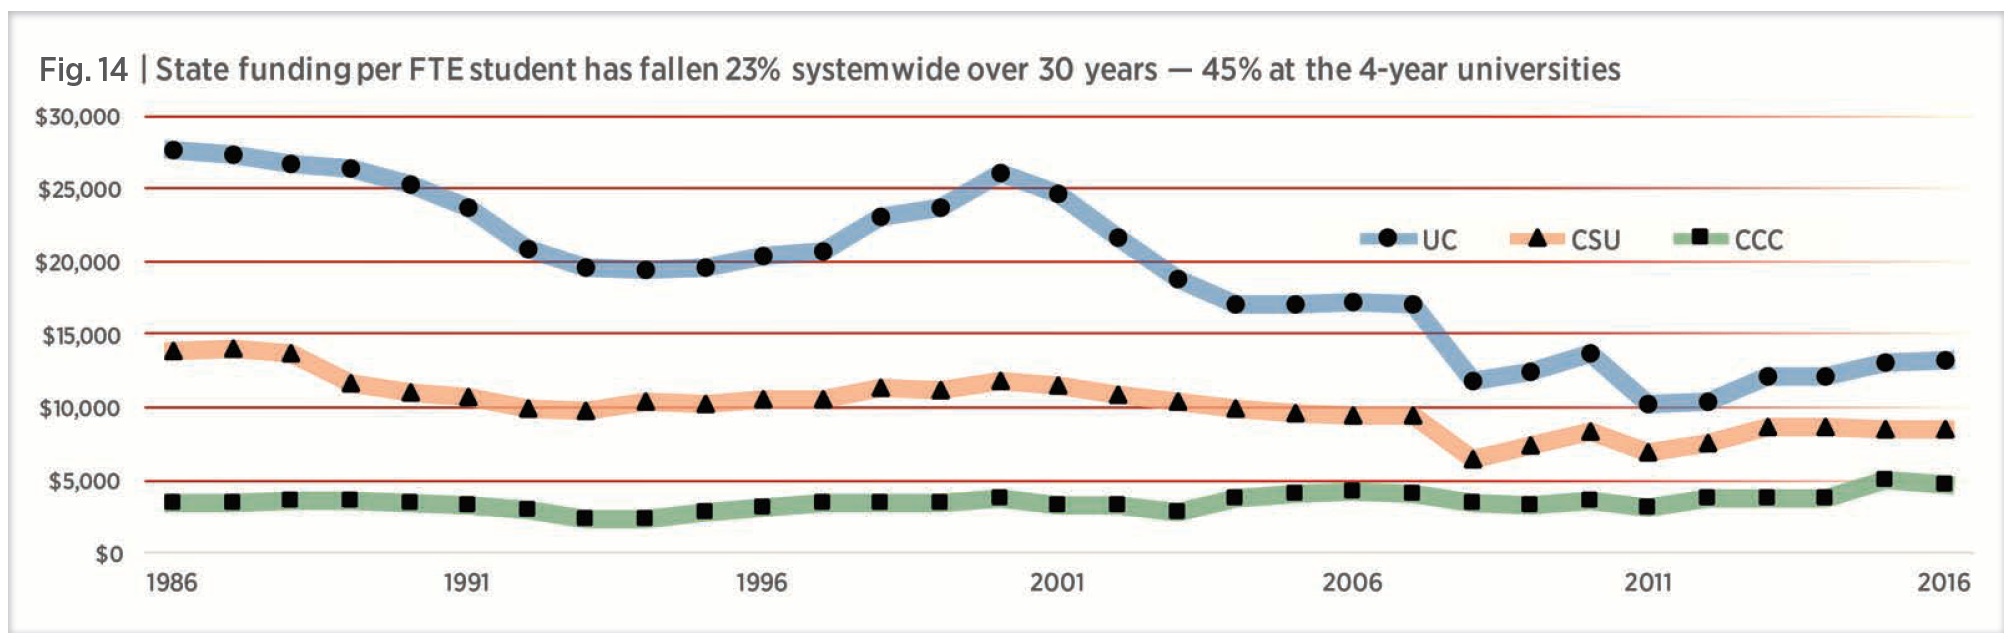
Nevertheless, for decades, California has disinvested from the state’s three-part higher education system. Overall, in real dollars, public funding per full-time equivalent (FTE) student fell 23 percent from 1986 to 2016. The CSU and the UC together have lost 45 percent of their state allocations per student (Figs. 11, 12, 14). The CCC, its funding stream protected by Proposition 98, has seen modest increases (Figs. 13, 14).
SOURCES | State funding for higher ed (General Fund): Historical expenditures in LAO (1); 2014-16 in eBudget Sched. 9; 2016-17 in LAO (2)
At the same time, the share of California students from low-income families has risen steadily. The share of California’s K-12 students approved for subsidized school lunches increased from 35 percent in 1989 to 52 percent in 2007 and 60 percent in 2012.18 Low income students are the most in need of improved educational attainment: students from the wealthiest fifth of families graduate from college at about seven times the rate of students from the lowest-income fifth.
Yet they arrive at college with essentially no resources to pay tuition.
In 2005, the Public Policy Institute of California began to publish demonstrations that California is not producing enough bachelor’s degrees to staff its own economy.19 “If the trends continue,” their report estimated, “there will be a gap between the number of college graduates demanded by the state’s economy and the number of Californians with college degrees.”20 The PPIC repeats this warning on a near-annual basis, calculating most recently that California will lack at least 1.1 million skilled workers in 2030.21
If California had stayed true to the Master Plan, we would now have the skilled workers California needs.
In spite of such warnings, California officials forced public colleges and universities to respond to the financial crisis of 2008 by reducing basic access—leaving aside class size and other resources that affect educational quality.

After 2010, the California economy recovered, but college access, affordability and attainment did not.22 Two 2014 reports signaled an alarming lack of progress towards the goal of increasing the state’s output of associate’s and bachelor’s degrees.
One, from the University of Pennsylvania’s School of Education (Penn), found that California’s problem was not so much about overall degree completion rates—these were somewhat above the national average. Instead, the problem was one of disparities among completion rates in different parts of California’s three-segment system.
Penn reported that, among UC students (2001 cohort), 80 percent earned a bachelor’s degree after six years. At CSU, the rate was 47 percent; at CCC, 28 percent after six years—for a two-year degree.23 The completion rates correlate strongly with the rigor of admission requirements. For example, the community colleges are open-access institutions for which California residents must meet only one of three requirements: be 18 or older, be a high school graduate,or have the equivalent of a high school diploma.
Many students attending community colleges are not focused on getting a degree. Even those who enroll with the intent to transfer to a four-year institution often do so without obtaining a two-year associate degree along the way: 51 percent of CSU graduates and 29 percent of UC graduates start their higher education at a California community college.24
The segments’ disparate attainment rates also aggravate the ethnic disparities in attainment. The fastest-growing segment of the workforce is Latino. Penn noted, “Hispanic students are clustered at community colleges and for-profit institutions: 36 percent of community college students were Hispanic in 2011, and 66 percent of all for-profit enrollment was also Hispanic in the same year.” Even when underrepresented minority (URM) students attend UC or CSU campuses, racial disparities persist, Penn noted:
Hispanic and Black students graduate at much lower rates than their White peers at both UC and CSU. In UC’s 2001 cohort, 80.5 percent of White students graduated within six years, compared with 73.1 percent of Hispanics and 70.2 percent of Blacks. The gaps were substantial also for the CSU 2001 cohort graduating in six years: 52 percent of White college students were graduating in six years, compared with only 43.9 percent of Hispanics and 35.7 percent of Blacks.25
Education scholars are well aware that disadvantaged students need help to close the gap in graduation rates. Underfunding prevents the CCC and CSU from offering the academic services their disadvantaged students need. Consistent advising is important to academic success, yet California community colleges have had to work with a student-to-counselor ratio of 2000:1.26
The second report, “A New Vision for Higher Education,” from Sacramento State’s Institute for Higher Education Leadership and Policy, noted that California
…ranks 48th in the number of certificates and degrees awarded as a share of students enrolled in community colleges. Low completion rates in the two-year sector have an especially large impact because California sends more of its students to community colleges than any other state, with 73% of public undergraduate enrollment in the two-year sector compared to a national average of 52%.”27
While the state’s older population remains near the top of national rankings in degree attainment, California’s 25-34 year olds are barely average.28
These problems are a direct result of political decisions, made largely by California governors, with the support of legislators, that sent California’s
once-preeminent higher education system into decline. Most of the shortfall in graduates is a direct result, not of failures intrinsic to the Master Plan, but of the failure to follow the Master Plan and instead pursue privatization.
What doesn’t work
Because the master Plan continues, at least in name, to define California’s public higher education segments, several think tanks have formally called for the Master Plan to be “repaired.” Yet they presume
that the trend of state disinvestment in public higher education will continue. They limit themselves to tinkering with “efficiencies” and bypass the need for fundamental reform.
University of Pennsylvania’s School of Education (2014)
The University of Pennsylvania’s report concludes with a dire warning:
…the only core tenet of the California Master Plan that is largely intact is the mission differentiation of the three public segments of higher education, and this has begun to erode with the CSU receiving approval for offering an Ed.D. degree in education… Lost, however, are many of the core policies related to access, transfer, and affordability of higher education. There is little evidence that the continuation of the Master Plan can change the level of political indifference or help California navigate a new, 21st Century economy. There is also little evidence that the solutions developed by each higher education segment since 1990 to address California’s changed environment will be sufficient for the challenges ahead.29
The authors called for better educational planning without any conviction that the state has the political capacity to pull that off. Their report’s title is a dour epitaph: “From Master Plan to Mediocrity.”
Cal State Sacramento’s Institute for Higher Education Leadership and Policy (2014)
The Sacramento State report agrees with Penn’s general diagnosis, but sets specific performance goals and proposes governance changes to meet them. The changes consist of a “three-part strategy of regionalism, specialization, and technology.” In the first part, each state region would form a consortium of its colleges and universities that would identify regional needs and set targets for career readiness, as well as “targets for numbers of degrees and certificates, generally, and in key fields, and targets to close performance gaps across racial/ ethnic groups.”30
Each institution would need to show the regional board that it has “developed pathways within each program for students to follow that would facilitate timely completion.” The regional board would also provide “a spectrum of work-based learning opportunities from high school through university, as a key contribution of employer participation in the consortium.”
Finally, the governor and legislature would create a new office of higher education to coordinate the various regional consortia policies across the state. The consortia would reduce or even override the differences among the existing segments, and perhaps replace their existing governing boards. Efficiencies would be anticipated from reducing segment autonomy and ostensible duplication.
The second and third components of the Sacramento State strategy would work together. The regional consortia would “eliminate unnecessary duplication across the region, build on institutional strengths to deliver the most cost-effective instructional approaches, and meet unmet needs.”Once the regional board had helped each institution become distinctive by setting specific priorities, it would enable them to “serve students effectively and use resources strategically.”31
Elimination of “duplicate” programs—closing half a region’s Political Science and Spanish departments, for example—would require online courses to replace face-to-face learning. With all three segments already heavily reliant on part-time instructors and non-tenure track lecturers, who make ends meet by commuting across all colleges in a region to teach their courses, the savings would be limited.32
The regional consortia would also influence financing of colleges and universities:
The public colleges and universities would collaborate within each regional consortium to identify their roles in providing cost-effective education to meet regional needs. Judging cost-effectiveness would require the segments to modify their fiscal accounting and reporting practices, in accordance with definitions adopted by the state. Segment leaders would then “roll up” the regional plans into their system-wide budget requests and align their subsequent campus allocations with the regional plans.33
The Sacramento State report contrasts regional input with the statewide perspective of the current Master Plan, which it describes as too “cookie-cutter” to respond to regional needs. California higher education would reorient towards regional workforce needs, structure its curricula through collaborations with a new regional bureaucracy, and be held accountable through state-coordinated target-setting and benchmarking procedures.
Public Policy Institute of California (2010)
In “New Goals for the Master Plan” (2010), PPIC proposed a solution that would be echoed by later studies. It called for expanding eligibility rates in each segment and improving transfer and completion rates.34 The report advocated a set of numerical targets: enlarge UC eligibility from 12.5 percent to 15 percent of high school graduates, and CSU eligibility from 33 percent to 40 percent.
Transfers from community colleges would increase to “constitute 40 percent of all UC baccalaureate degrees and 60 percent of all CSU degrees.”35
PPIC argued that another cost-effective way of closing the skills gap would be to push up CSU’s 6-year graduation rates to 69 percent by 2025.
Notably, PPIC did not call for increased state funding to pay for this expanded access. The same is true in its updated report, “Higher Education in California” (April 2016).36 Although the PPIC’s goals are correct, its reports do not outline how to achieve them.
Summary | The 2014 University of Pennsylvania report saw no obvious remedy for California’s new mediocrity. The 2014 Sacramento State report called for wholesale re-engineering and a new managerial apparatus for exerting direct external control. The 2010 and 2016 PPIC reports emphasized expansion of eligibility with no mention of increased state funding or other specific mechanisms to increase graduation rates. Penn resigned itself to the status quo, Sacramento State rejected the status quo only to invent something worse. PPIC diluted the status quo by calling for expanded access without new resources.
These reports focused largely on the CSU and CCC segments, as part of their preoccupation with “workforce training,” narrowly defined. None of the reports engage with the austerity-driven, privatized environment; provide cost estimates for their solutions; or use data to estimate the educational effects of their proposals. Indeed, policymakers’ failure to grapple with these specifics has led to California’s current predicament: either access must be restricted or quality be diluted—or both—even as students take on billions in debt.
In contrast, this report does propose a funding mechanism that restores access and quality.
Three myths about higher education
The Policymakers we have cited are about the best around. Why are their proposals inadequate, if not downright dangerous? The main reason is that they are working with a framework or paradigm that assumes that the main purpose of a college degree is to prepare students for a well-defined workforce.
This approach was reasonable during most of the 20th Century, when bachelor’s degrees were scarce and any kind could be used anywhere, and later, when white-collar jobs were growing at such a high rate that a basic B.A. could get nearly anyone through the hiring door.
Neither of these conditions exists today.
Today’s California graduates are competing not only with graduates in other states that have improved their university systems, but with graduates around the world who can do high-skill jobs for relatively low wages.37
California will not be able to repair our broken public higher education system unless policy makers focus on the quality of the educational experience:
Myth #1: The learning problem is a quality problem. Reality: It is a budgetary problem.
Quality instruction requires reliable, sustained, robust investment in instructional staff and infrastructure. To avoid deepening the caste system among their graduates, California’s public colleges and universities must match the level of quality achieved by traditional private competitors such as Stanford, Harvard and MIT, and also by smaller, high-quality, nonprofit institutions.
In contrast, after 2000, per-student state investment at UC fell by half and at CSU by more than 25 percent (Figs. 11-12). Even though tuition skyrocketed in the first decade of the 21st Century (Figs. 4-6), those very large increases were insufficient to offset disinvestment by the state, resulting in a decline in quality.
State funding untied to personal income | Over the years, officials have claimed the “fluctuations” in state funding for higher education mirror the state’s business cycle and Californians’ income. This view has always been incorrect, except perhaps in the case of the CCC, where funding is calculated by a Prop 98 formula.
A comparison of Californians’ reported Adjusted Gross Income (AGI) and general fund allocations to higher education shows that California policy- makers let public higher education funding slide nearly 30 percent behind state AGI through thirty years of recessions and recoveries (Fig. 19).

SOURCE | AGI, Franchise Tax Board: 1986-2013; 2014; 2015. 2016 projected, based on 2014-15 change.
While the percentage changes appear small, the real dollar amounts are large. If the state had contributed as much to higher education in 2016 as it did in 1986—as a share of state AGI—California’s public colleges and universities would have received $5.25 billion more in 2016: more than half (56%) of the state funding needed to deliver accessible, tuition-free, top-quality higher education at 2016-17 enrollment levels (Table 1, page 21).
If higher education received as much in 2016 as it did in 2001 (1.17% of AGI) our colleges and universities would have an additional $2.75 billion: 29 percent closer to the fully-funded Master Plan. If state funding were set at 1.5 percent of AGI in 2016, higher education would have $7.1 billion more—75 percent of the new funding required to give California the higher education system it needs and
The politics trace back to 1978’s Prop 13 and the anti-tax movement that continues to undermine California’s proven post-World War II growth model. This model was founded on publicly funded infrastructure: transportation, water management and other public services, together with an education system that was the envy of the rest of the country. By lowering property evaluations and limiting property tax increases, Prop 13 eliminated the stable tax base that financed California’s infrastructure.
Political cover for state disinvestment | Many business and political leaders continue to believe that tuition hikes offer acceptable cover for the state’s disinvestment in higher education. UC offers an example.
In 2015-16, UC received around $2.8 billion in general funds.38 That general fund total included debt payments on UC’s General Obligation bonds, which the state had formerly paid on its own, so operational general fund receipts were about $2.6 billion. This is exactly where funding, in nominal dollars, had been ten years before—disregarding ten years of inflation and double-digit enrollment growth.
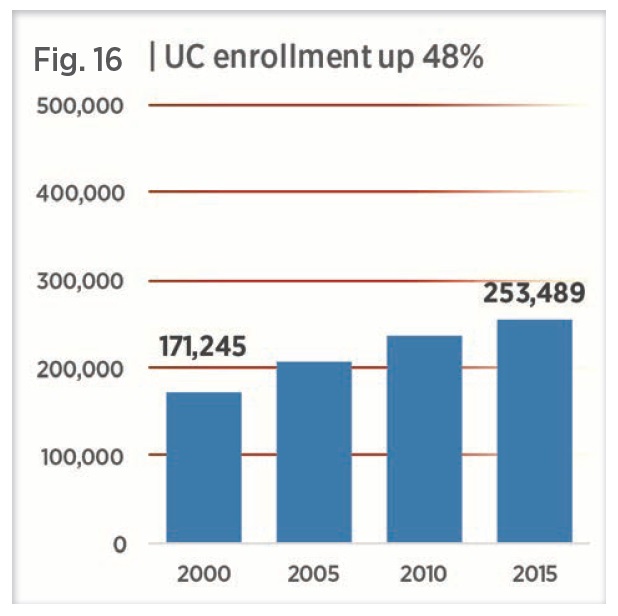
And yet, although tuition increases under this privatized model have been very large, they have not made up for the cuts. UC grossed $600 million in tuition in 2001-02 and about $2.87 billion in 2014-15, for a gain of about $2.2 billion in today’s dollars, which seems at first to make up exactly for the general fund cuts since 2000-01.39 But one-third of tuition receipts ($730 million) went to financial aid for other students. Another $1.1 billion went to educate the added number of students enrolled at UC—55,000 more (equal to two additional UC-Santa Barbara campuses) at $19,590 per head.40
So, of the $2.2 billion in tuition revenues above the 2000 baseline, only $370 million in net new tuition funding is left for core UC operations. This money replaces only 17 percent of the cut state funds. In other words, depending on cost assumptions, tuition increases have made up for somewhere between 20 percent and 50 percent of the state cuts. UC estimates—with somewhat different assumptions—that tuition increases have made up about one-third of the state funding cuts.41
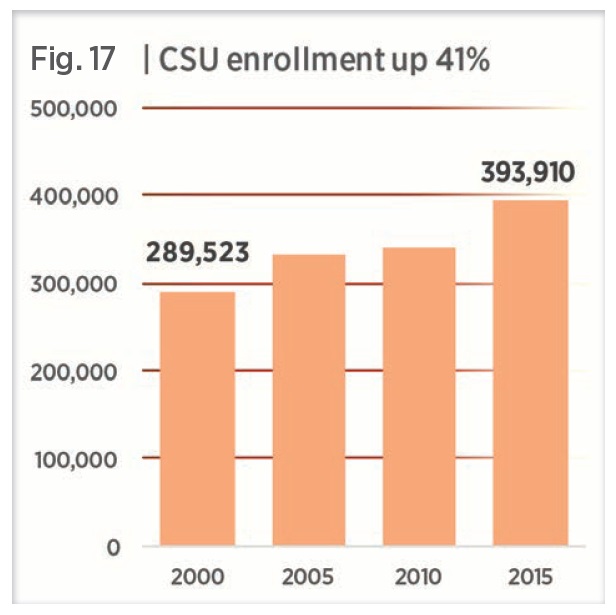
At the CSU, enrollment grew by 41 percent (120,000 FTE students) between 2001 and 2016 (Fig. 17). Over the same period, state funding for CSU in real dollars was essentially static, meaning that state funding per student plunged 27 percent (Fig. 12). At the same time, CSU tuition and fees climbed 168 percent (Fig. 8). State funding and net student revenue combined fell 2.4% per student in those years. By 2016, CSU was spending nearly 10 percent less per student than it did thirty years ago.
In short, neither the UC nor the CSU had a “tuition option” to maintain educational quality even when they could raise tuition drastically. Many state leaders have persuaded themselves that Master Plan funding has been maintained with tuition hikes. They are wrong. In 2016-17, California’s public universities will operate on $800 million less than if state funding and tuition revenues, per student, were still at 2000-01 levels. With less money, the system can not protect educational quality, much less rebuild it.
Myth #2: Student advancement is a management problem. Reality: It is a learning problem.
The policy analyses assume that the Master Plan does not offer clearly marked pathways from one higher education segment to the next. Since access and transfer mechanisms are subject to intense political scrutiny, they are regularly reviewed and updated. The segments are now in the midst of another full-scale review of the transfer process.
In 2010, under SB 1440, the legislature mandated a streamlined transfer program from California’s community colleges to the California State Universities. Students who earn CCC’s 60 semester-unit Associate Degree for Transfer (ADT)—including general education courses and 18 units in a specified major—receive priority admission into a similar baccalaureate degree program at the CSU. The student is not guaranteed transfer to a specific CSU campus or to a particular major, but once admitted, the student need complete only 60 additional stipulated units to earn a bachelor’s degree.
While both CCC and CSU faculty remain uncomfortable with the unit restrictions imposed by SB 1440, ADTs grew nearly thirty-fold between 2011-12 (722 ADTs) and 2014-15 (20,644 ADTs). It is not clear how the growth in ADTs influenced the total number of transfers. Over this same period, transfers from the CCC to the UC were essentially unchanged, at about 16,000 per year, while transfers from the CCC to CSU fell from some 51,000 in 2011-12 to 44,200 in 2012-13 before climbing to 56,600 in 2013-14 and 57,800 in 2014-15.42
Programs like the Associate Degree for Transfer reflect widespread awareness among faculty and administrators that access and transfer are essential functions of the Master Plan. Ongoing attention will help further remedy remaining transfer issues.
Student completion rates are not pathway issues as much as funding issues. Funding shortages keep California higher education from remedying weaknesses in college preparation that, in turn, derive from California’s relatively low investment in K-12 education. Very high percentages of CCC and CSU students require remediation at the start of their college careers. Studies find that the students who start college with remedial courses are least likely to complete a degree.43 Full-time students who work longer hours at jobs take more time to graduate or fail to graduate at all.44 Unfortunately, the CSU Graduation Initiative study conducted by CSU management meticulously avoids addressing how many hours students are working to support themselves and the extent to which working hours interfere with study and time to graduation.45
When the CSU was committed to delivering one-year of remediation, the large majority of students needing remediation caught up with their peers. Because the CSU has failed to tackle remediation costs head on, students have dropped out who would have succeeded with better help. Shifting the Basic Skills burden to the CCC, a trend that intensified during the recession, was also unproductive. Big spending on abbreviated programs and online courses has proven to be a loser. Commitment of time by well-prepared faculty makes the difference.46
Myth #3: Student learning is about quantity.
Reality: It is about the quality of students’ education.
Higher education policy has focused excessively on quantities of degrees produced, rather than on the educational quality of each degree. It is quite easy to increase number of degrees per dollar spent, if quality is ignored: reduce graduation requirements, standardize tracks within majors, shorten the B.A. duration from four years to three, teach more material in large lecture formats, digitize examination grading, and automate advising.
Since the 1970s, public colleges have also reduced costs per degree by shifting from permanent, full-time faculty to part-time, contingent faculty. But even if further money can possibly be saved by decreasing quality, which is doubtful, the outcomes will not match what the economy and society require. Indeed, cost-cutting insures that quality will never improve.
Quality is a complex topic, in part because the various university disciplines have “distinct socializing environments which foster development of specific skills, attitudes and values.”47 But we can make some useful generalizations about the quality of education now required by public university undergraduates.
What quality means | There is considerable agreement that colleges and universities should teach broad conceptual skills. This agreement typifies academic and business definitions of the cognitive capabilities that all post- secondary degree holders should have.
For example, the Collegiate Learning Assessment, developed by the Council for Aid to Education, assesses “critical thinking, complex reasoning, and writing.”48 In surveys, business leaders make similar lists. One 2013 study found that business executives want graduates to have both “field-specific knowledge… and a broad range of skills and knowledge.”49 When asked what colleges should teach in order to develop this broad range, the six most desired abilities were:
- Critical thinking and analytical reasoning skills
- The ability to analyze and solve complex problems
- The ability to effectively communicate orally
- The ability to effectively communicate in writing
- The ability to apply knowledge and skills to real-world settings
- The ability to locate, organize and evaluate information from multiple sources.
These and related abilities are enabled by the “cognitive gain” that students and society expect from undergraduate study. There is general agreement about the value of these abilities, regardless of whether one discusses learning with professors or corporate managers.
Beyond workplace training | These capabilities go well beyond workplace training, narrowly conceived as immediately applicable content, such as knowledge of historical cash flow statements or a computer coding language. The desired capabilities enable work to be done but also enable public goods that go well beyond the workplace, starting with the complex skills of democratic citizenship. Colleges and universities create general capabilities that enhance workforce performance—and a healthy social existence.
These capabilities develop over time and are endangered by excessive compression. It is easy enough to learn a package of information on a well- understood subject and to repeat this information back in the order received. We know how to induce this via traditional techniques of mass, passive learning, particularly the very large lecture staffed with teaching assistants and evaluated with standardized multiple-choice tests. This kind of knowledge is somewhat useful but does not develop new learning capabilities. It is also mostly soon forgotten.
We have made great strides in identifying the components of meaningful learning. It requires “spaced practice”—cycles of learning, forgetting and relearning over time. Practice should be “interleaved,” meaning that students should alternate among a set of diverse topics. Students retain knowledge when they can place it in larger context where the stakes of acquiring it are clear.
Students need time to reflect on the knowledge they have acquired and the processes whereby they can acquire it.50
Even the simple set of employer requirements—critical thinking and effective communication—requires several elements that are most readily found in colleges and universities.
- Individual attention | Everyone learns differently—at different rates on different material, even in the same course. Learning requires feedback for the sake of correction, encouragement and pinpointing of specific problems affecting the learning of the whole. In the same survey of U.S. history, for example, one student will understand political terms like “hegemony” but need more help with the history of sectional economic Her best friend will be exactly the reverse.
One term applied to this issue is “mastery learning.” The concept was developed by Benjamin Bloom and others in the 1950s and 1960s and recycled by Massive Open Online Course advocates after 2011. The basic idea is that learning should be designed so that students learn all of the material, not just some fragment of it. In one version, mastery learning improves learning through regular “formative tests” and “corrective feedback procedures” for individual students. At the same time, one-on-one tutoring yields about 85 percent improvement for more than 97 percent students. Educational technology cannot accomplish what learning in small groups can. Small groups address individual student’s particular needs. High-quality colleges and universities offer the small scale and intensity that assures individual attention.
- Integration across topics and disciplines | Colleges and universities support dozens of departments and hundreds of sub-disciplines. Students are able to try selected cognitive practices on a range of topics, or a range of approaches garnered from different disciplines on one problem. Virtually everyone agrees that the great problems of the world require interdisciplinary expertise on an unprecedented scale, assembling a range of expertise to integrate diverse approaches.
Pressure to achieve “efficiency” by eliminating low-demand programs, narrowly specializing programs and entire campuses, and pushing students to graduate quickly ignore this reality. In contrast, the most important problem- solving, whether in business, government, the arts, science or communities, require graduates with diverse expertise who can work in teams with other complex thinkers.
- Continuous experience of the knowledge frontier | Students at the knowledge frontier learn the limits of understanding in a particular subject. They need to solve They learn ways of thinking that can convert doubt, ignorance, confusion and uncertainty into insight.
Colleges and universities in the 21st Century must use their distinctive combinations of people, expertise and facilities to instill three related capabilities in undergraduate students.
■ First: How to deal with ambiguity and uncertainty, inherent in the complex problems of contemporary business and society.
■ Second: How to solve problems that require creating knowledge rather than applying what is already known.
■ Third: How to devise new rules and procedures when existing ones do not work.
Public colleges and universities have gone as far as they can with a 20th Century model of mass instruction. This model has focused on bulk delivery of relatively standardized product, while also maintaining a foundation of “craft production” that has shaped advanced education, particularly in doctoral programs and medical education. Public colleges and universities must now introduce craft-production elements throughout the undergraduate system.51 California’s three segments have not done this already simply because they lack the funding.
California’s community colleges present an example of efficiency-based reform gone wrong. The Student Success Initiative imposed on the CCC during the recent recession offers a much narrower vision of higher education to today’s students. Education is focused on technical training to meet industry’s needs with little attention to enriching students’ lives and developing their critical thinking. In place of the kind of education enjoyed by an economic elite who can afford it, this reform offers today’s diverse student body an assembly-line version of higher education limited to producing graduates degree-certified to take their place in the industrial workforce, not the post-industrial workplace.
The harsh, new reality that students experience in the CCC includes tight unit limits, early declaration of a major and educational plan, reduced repeatability options, and stricter standards for financial aid eligibility and fee waivers.
All of these policies make it harder for struggling students to stay in school. In addition, a premium is placed on full-time enrollment, which makes it even more difficult for part-time students juggling work and family responsibilities to make progress.
While some “reform”-minded advocates laud the apparent rigor of pushing a set of limited outcomes, the model falls far short of the 1960 Master Plan’s ideals.
Funding research under the Master Plan
The Master Plan makes the conduct of research a central part of the University of California’s mission. Research makes important contributions to the University’s educational mission at all levels. The development of new knowledge also enriches California society, positioning the state as a leader in the knowledge economy.
The people’s experts | While attention is focused on research’s value to the state’s economy (viewed narrowly), the University’s faculty, staff and students also play a key role as “the people’s experts.” Independence from private interests allows public agencies, the media and the public at large to call on the University for impartial information and advice about highly technical, controversial issues—among them drug safety, toxic chemicals, global warming and alternative energy.
Serving this role requires maintaining the integrity and independence of academic research. The classic, confident mid-20th Century definition of scientific norms came from the Columbia University sociologist Robert K. Merton. One of his four core norms was “disinterestedness,” that is, researchers always and everywhere putting the pursuit of knowledge ahead of personal interests, especially pecuniary interests.52 His other three norms addressed the capacity of research institutions to resist political, economic or personal coercion: the validity of research depends on it. The university has been the model and foundation of disinterested inquiry. Disinterested inquiry has made all of the fundamental conceptual breakthroughs that underwrite modern life.
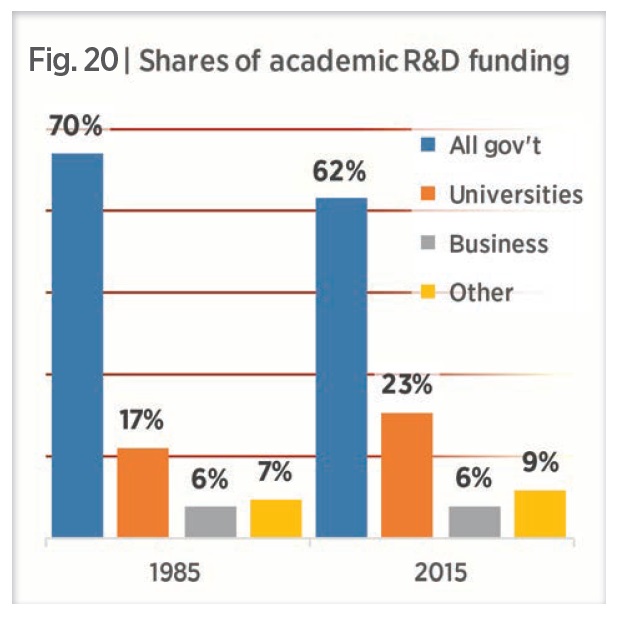
WHO PAYS FOR RESEARCH? | In 1985, universities put up 24¢ for every government dollar funding academic science and engineering R&D (17% of total funding). By 2015, they were putting up 37¢ for each government dollar (23% of total funding). Private business has not boosted its 6 percent share of academic R&D in decades. (Source: National Science Foundation)
While most costs of research are supported by external agencies, a solid base of state funding has allowed the University to maintain its independence.
More important, when the University saw its primary allegiance to be to the people of California, it was easier to maintain the social norm that the university community places the public interest ahead of private interests.
In contrast, when faculty members, researchers and administrators see their constituency as private funders, they logically respond to those funders’ interests. Private interests may not only differ from the public interest, they can conflict with it. There is nothing wrong with the University having cordial relationships with business—businesses are a key part of California. But undue reliance on business subtly refocuses the entire academic enterprise away from the public interest.
The same risk may be true of government funding: in a dramatic recent case, the residents of Flint, Michigan, had to go to a researcher in Virginia for objective toxicological findings about the lead in their drinking water. This situation was caused both by funding shortages at the local university and by concern among local academics that confronting local political powers with evidence of their malfeasance could worsen those shortages.53
Impartiality of research is a key public value | This is true not just for the public as a whole, but also for government, business and other funders. All rely on universities to provide independent results on basic research topics. Over the past fifty years, industry has retreated from basic research. Major industrial laboratories, such as Bell Labs, have been closed or are shadows of their former selves. This sea change has put additional pressure on universities to supply the vast majority of the state’s and nation’s basic research. University researchers’ responsibilities are enormous. Society asks them to solve every kind of problem from climate change and viral pandemics to improved racial relations and restored economic growth. But federal and state research funding, adjusted for inflation, has been flat or falling. Universities are being asked to do more research on more complicated problems with less money.
Furthermore, university faculty members, administrators and policy- makers generally assumed that business “partnerships” would replace lost public funding for academic research. This hope has not come to pass.
The government’s share of academic R&D has sunk below 1970s levels and is headed even lower. The University of California’s 2015 “Accountability Report” reflects this trend. UC’s federal revenues were rising at one time but have flattened out. Private business has not picked up the slack. This means that university-industry partnerships cannot replace lost public funds (Fig. 19). State investment is stable, but these funds are usually earmarked for specific projects. Greatest growth is seen in the University’s use of institutional funds to support research (“University support”).54
Why research is now about subtraction, not addition | Extramural research funders, including the federal government, require cost sharing on the grounds that conducting research is a core mission of a university, so the university should contribute part of the cost.55 (Cost sharing is usually accomplished through unreimbursed indirect costs.) When the University of California was in good financial shape, it possessed resources to support the unreimbursed costs of sponsored research and business partnerships. The University viewed the expense as an investment that allowed it to leverage extramural funds to expand academic effort at a relatively small cost to itself.
When the University no longer has sufficient resources, it must subtract from other core programs to pay the costs of extramural research. Most officials persist in the view that research is a moneymaker, generating “profits” from extramural grants to fund the University. In reality, there are only losses. Growing reliance on extramural funds digs the University deeper into a financial hole, while distorting its research priorities. Failure to support the University’s core missions of teaching and research with state funds leads to a cascade of negative effects on research, instruction and the public interest—all at the same time.
A decade ago, in 2007, BloombergBusinessweek reported that the costs of research were increasingly only affordable to richly endowed private Ivy League colleges and beyond the reach of public universities. The publication asked if this situation would “accelerate the deterioration of many other schools that have a vital role to play in training the next generation to compete more successfully in math and the sciences?”56 The current research funding model risks UC’s solvency and role in science. Reinvigorating the Master Plan will restore balance to the system and resolve these problems.
Graduate and professional education
While most Public discussion has focused on privatization’s impact on undergraduates, large increases in tuition and fees have also harmed graduate education.
High-quality graduate students play a key role in the University of California’s educational and research missions. Under the Master Plan, the University has central responsibility for preparing the next generation of research leaders and for conducting a wide range of research. Graduate students are at the center of these activities. Attracting and supporting high caliber graduate students is essential to maintaining California’s decades-long leadership in research.
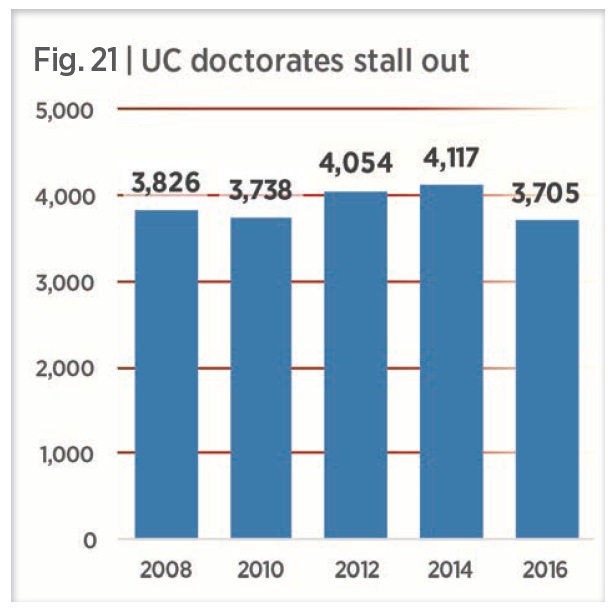
SIGN OF THE TIMES | While UC awarded 20 percent more undergrad and masters degrees in 2016 than in 2008, the number of doctorates awarded actually shrank. PhDs comprised 6.9 percent of all UC degrees earned in 2008; by 2016 they made up 5.6%, the lowest share in at least fifteen years. (Source: UCOP)
Whereas undergraduate students compete to get into the best school, world-class graduate programs compete for the best students. As part of this competition, the best graduate programs pay the tuition and fees for many of their students and try to provide them stipends for living costs. In the humanities and social sciences, these costs are usually covered by having the student work as a teaching assistant in undergraduate classes.
The increases in tuition and fees combined with reductions in state support for these programs has led to a reduction in the number of opportunities to serve as teaching assistants. This situation not only undermines the size and quality of these programs, but also reduces the human resources available to assist in undergraduate instruction. The sciences, which generally enjoy higher levels of extramural support, mostly support graduate students as research assistants on research projects, which are also subject to the same financial pressures generated by dramatic increases in tuition and fees. This situation is aggravated by unstable or declining federal funding in many of these areas.
Given shrinking financial resources, tuition increases siphon research funds away from graduate student support, reducing the number of opportunities for graduate students. Moreover, graduate stipends at the University of California have been below those of competitive institutions for years. This has made it increasingly difficult to attract graduate students, and has impacted the quality of both teaching and research. This problem was highlighted in a June 2006 report to the UC Provost on competitive graduate student financial support,57 and the situation has only deteriorated since then.
Eliminating tuition and fees for in-state students would provide a dramatic improvement by increasing available funding for employing a graduate teaching or research assistant and freeing up grant and departmental (state) funds for increasing graduate student stipends, thereby substantially improving the graduate student experience.
Distortions created by reliance on private fundraising
Besides charging students more, privatization has led to a dramatic increase in private fundraising activity. While philanthropy, like sponsored research, can bring new opportunities to higher education, it is not a substitute for core state funding. Philanthropy nearly always pursues specific projects, rather than the core academic mission of quality education, independent research, and public service that define a publicly-funded institution.
Academic leaders have seen their responsibilities shift from shepherding public funds to chasing private money. Individuals tasked with raising tens or hundreds of millions of dollars demand much higher rewards than people who responsibly and resourcefully administer funds appropriated by the Legislature.
Success in private fundraising creates a feedback loop. State policymakers protest, “Why should we give you precious state funds, when you have a well- oiled fundraising machine that other public programs don’t?” Meanwhile, legislators hear and repeat the public’s complaints about executive compensation, while campuses can compete in fundraising only if they pay well enough to attract the highest-performing fundraisers.
A closely related issue is the difference between the operating and capital budgets for California’s higher education institutions. Donors are most interested in putting their name on a building, so much donor money goes to major capital projects. In the past the state would use general obligation bonds to fund the facilities needed to house education and research. Now, with less bond funding, campus development staffs fill the void by raising earmarked donations for buildings that may be a priority for the donor, but not for higher education in general.
While the budget estimates in this report focus on the operating budget, restoring this funding would better care for buildings and cover basic plant maintenance, including such everyday things as washing windows and keeping toilets functional. Philanthropists are not in the habit of making service calls.
Reclaiming the Master Plan
Since the University of California was created in 1868, the people of California have intended that “as the income of the University shall permit, admission and tuition shall be free to all residents of the state.”58
This idea was reaffirmed in the 1960 Master Plan for Higher Education in California, which called for all three segments of California’s public higher education system to welcome students tuition-free.59
The political presumption has been that reinvigorating the Master Plan is prohibitively expensive. Our analysis shows that it is eminently feasible.
We can afford all qualified California students tuition-free, top-quality higher education—if the political will exists to do it. It is within California’s reach to restore quality, guarantee access, remove economic barriers, and eliminate most (if not all) future student debt.
This analysis aims to answer one fundamental question: How much will it cost California families to do just that?
Restoring the full Master Plan
Table 1, below, shows the calculations that produce the answer to this question. Because the CSU’s and UC’s funding model and history are quite different from the CCC’s, we treat the CCC separately.
For the CSU and UC, we seek to restore state funding to a level supportive of the Master Plan for Higher Education, assigning a 2000-01 base year for these two segments. 2000-01 was the last year before funding for higher education was shifted dramatically from state taxpayers to students and their families.
Restoring the Master Plan for CSU and UC | Starting with the amount of state funding and full-time equivalent (FTE) enrollment numbers for the CSU and UC in the 2000-01 base year, we divide the total state funding by the number of FTE students to obtain the state funding per FTE student. (FTE data comes from the individual higher education systems; state expenditure data comes from the Legislative Analyst’s Office).
| FTE students | State support per student | FTE students | State support per student | FTE students | State support per student | TOTALS | |
| 2000-01 base | 289,523 | $11,764 | 171,245 | $26,074 | 1,046,344 | $3,752 | |
| 2016-17 current | 409,382 | $8,548 | 264,633 | $13,247 | 1,244,836 | $4,639 | |
| Difference
from 2000-01 |
-$3,216 | -$12,826 | +887 | ||||
| Reset of state support | $1.32 billion | $3.39 billion | No reset required | $4.71 billion | |||
| Tuition revenue
2016-17 net |
$1.89 billion | $2.41 billion | $426 million | $4.72 billion | |||
Next, we inflation-adjust these 2000-01 dollar amounts to their equivalents in 2016-17. We then multiply the larger FTE enrollments at CSU and UC anticipated in 2016-17 by the inflation-adjusted, base-year 2000-01 funding per FTE student to obtain the total amount of state funding required to restore Master Plan support for CSU and UC.
The gap between this amount and what the governor has proposed for 2016-17 represents the additional funding the state would need to provide. Using this method, we estimate that restoring 2000-01 funding per 2016-17 FTE student at the CSU and UC would cost an additional $4.71 billion.
Unlike CSU and UC, funding per FTE student for the CCC did not decline from 2000-01 to 2015-16; it increased. Restoring the full Master Plan at CCC simply requires elimination of the student fees anticipated in the governor’s 2016-17 budget while maintaining the proposed per-student funding level.
Eliminating student charges across all segments | If the CSU, UC and CCC were made tuition-free in 2016-17, and the state replaced all anticipated tuition and mandatory fee revenue, it would cost $4.72 billion.
Total cost to restore the full Master Plan | The total cost to restore state support to California higher education to the 2000-01 level per FTE student and eliminate tuition and mandatory fees for in-state students: $9.43 billion.
California can afford the best. It can’t afford any less.
Without more federal funding for higher education,60 can California’s tax-paying households afford to restore the Master Plan? Table 2 outlines how the $9.43 billion cost of restoring tuition-free access to top-quality higher education for all qualified California students would be distributed among state taxpayers.
We obtained data from the Franchise Tax Board for 2014 showing state income taxes paid by adjusted gross income.61 Note that the categories are for individual filers (where individual returns are often joint returns for families), partnerships and Subchapter S corporations, as well as corporations that pay income taxes.
For the median personal income taxpayer (including families), restoring the entire public higher education system while eliminating in-state student tuition and fees would cost $48—less than it costs to acquire a special interest license plate. Table 2 shows the cost for taxpayers in all income brackets.
California taxpayers’ costs might be somewhat lower if plans broadly discussed at the national level in 2016 were implemented—including tuition- free community colleges for all and tuition-free, public 4-year colleges for families below a certain income cap.
The takeaway, however, is that California can well afford to restore its full Master Plan with its own resources. The world’s sixth largest economy was built, in large part, by the foresighted leaders who conceived the Master Plan nearly six decades ago, inspiring similar educational and economic breakthroughs in states and countries with whom California competes today.
Virtues of the income tax surcharge
In these Master Plan scenarios, income taxes are presented as the source of state revenue to be used to reclaim public higher education. An income tax surcharge is the simplest way to illustrate the cost for typical taxpayers, but alternatives are available. The important point of this calculation is that any tax plan, if equitably distributed, would cost the large majority of Californians a small amount of money and avoid increasing student debt.
Table 2 | Additional state income tax needed to restore 2000-01 base year funding per student and eliminate tuition, by taxpayer’s Adjusted Gross Income
|
Adjusted Gross Income (AGI) class |
Number of tax
returns |
Total tax liability ($ 1,000s) |
Percent |
Liability per tax return (average) | Additional tax needed to restore public higher education | Cumulative percent of all tax returns | ||
| Negative | 177,388 | $11,899 | 0.02% | $67 | $8.54 | 1% | ||
| Zero | 9,792 | $1 | 0.00% | $0 | $0.01 | 1% | ||
| $ 1 | to | $ 999 | 178,862 | $65 | 0.00% | $0 | $0.05 | 2% |
| 1,000 | to | 1,999 | 167,147 | $125 | 0.00% | $1 | $0.10 | 3% |
| 2,000 | to | 2,999 | 157,564 | $187 | 0.00% | $1 | $0.15 | 4% |
| 3,000 | to | 3,999 | 182,034 | $385 | 0.00% | $2 | $0.27 | 5% |
| 4,000 | to | 4,999 | 193,890 | $1,368 | 0.00% | $7 | $0.90 | 6% |
| 5,000 | to | 5,999 | 189,598 | $1,703 | 0.00% | $9 | $1.14 | 8% |
| 6,000 | to | 6,999 | 219,104 | $2,712 | 0.00% | $12 | $1.58 | 9% |
| 7,000 | to | 7,999 | 218,654 | $1,791 | 0.00% | $8 | $1.04 | 10% |
| 8,000 | to | 8,999 | 218,088 | $3,332 | 0.00% | $15 | $1.95 | 11% |
| 9,000 | to | 9,999 | 277,644 | $1,987 | 0.00% | $7 | $0.91 | 13% |
| 10,000 | to | 10,999 | 241,175 | $1,543 | 0.00% | $6 | $0.81 | 15% |
| 11,000 | to | 11,999 | 254,420 | $2,680 | 0.00% | $11 | $1.34 | 16% |
| 12,000 | to | 12,999 | 264,294 | $4,719 | 0.01% | $18 | $2.27 | 18% |
| 13,000 | to | 13,999 | 260,307 | $3,929 | 0.01% | $15 | $1.92 | 19% |
| 14,000 | to | 14,999 | 264,601 | $4,638 | 0.01% | $18 | $2.23 | 21% |
| 15,000 | to | 15,999 | 249,280 | $5,146 | 0.01% | $21 | $2.63 | 22% |
| 16,000 | to | 16,999 | 252,993 | $6,142 | 0.01% | $24 | $3.09 | 24% |
| 17,000 | to | 17,999 | 248,039 | $7,571 | 0.01% | $31 | $3.89 | 25% |
| 18,000 | to | 18,999 | 241,152 | $9,556 | 0.01% | $40 | $5.05 | 27% |
| 19,000 | to | 19,999 | 241,824 | $15,333 | 0.02% | $63 | $8.07 | 28% |
| 20,000 | to | 20,999 | 242,496 | $13,309 | 0.02% | $55 | $6.99 | 30% |
| 21,000 | to | 21,999 | 225,721 | $13,781 | 0.02% | $61 | $7.77 | 31% |
| 22,000 | to | 22,999 | 219,003 | $14,385 | 0.02% | $66 | $8.36 | 32% |
| 23,000 | to | 23,999 | 217,999 | $16,546 | 0.02% | $76 | $9.66 | 34% |
| 24,000 | to | 24,999 | 209,612 | $22,748 | 0.03% | $109 | $13.82 | 35% |
| 25,000 | to | 25,999 | 205,509 | $23,366 | 0.03% | $114 | $14.48 | 36% |
| 26,000 | to | 26,999 | 182,291 | $22,600 | 0.03% | $124 | $15.79 | 37% |
| 27,000 | to | 27,999 | 197,468 | $29,492 | 0.04% | $149 | $19.02 | 38% |
| 28,000 | to | 28,999 | 180,545 | $25,935 | 0.04% | $144 | $18.29 | 39% |
| 29,000 | to | 29,999 | 183,629 | $31,883 | 0.04% | $174 | $22.11 | 41% |
| 30,000 | to | 30,999 | 178,975 | $34,376 | 0.05% | $192 | $24.46 | 42% |
| 31,000 | to | 31,999 | 178,130 | $38,557 | 0.05% | $216 | $27.56 | 43% |
| 32,000 | to | 32,999 | 166,311 | $35,055 | 0.05% | $211 | $26.84 | 44% |
| 33,000 | to | 33,999 | 168,708 | $39,674 | 0.05% | $235 | $29.95 | 45% |
| 34,000 | to | 34,999 | 164,887 | $42,307 | 0.06% | $257 | $32.67 | 46% |
| 35,000 | to | 35,999 | 145,475 | $40,328 | 0.05% | $277 | $35.30 | 47% |
| 36,000 | to | 36,999 | 165,362 | $55,064 | 0.07% | $333 | $42.40 | 48% |
| 37,000 | to | 37,999 | 156,557 | $54,141 | 0.07% | $346 | $44.04 | 49% |
| 38,000 | to | 38,999 | 152,472 | $57,203 | 0.08% | $375 | $47.77 | 49% |
| 39,000 | to | 39,999 | 140,823 | $53,090 | 0.07% | $377 | $48.01 | 50% |
| 40,000 | to | 49,999 | 1,229,026 | $676,081 | 0.91% | $550 | $70.05 | 58% |
| 50,000 | to | 59,999 | 966,780 | $906,695 | 1.22% | $938 | $119.42 | 63% |
| 60,000 | to | 69,999 | 770,856 | $1,073,854 | 1.45% | $1,393 | $177.39 | 68% |
| 70,000 | to | 79,999 | 639,247 | $1,186,512 | 1.60% | $1,856 | $236.35 | 72% |
| 80,000 | to | 89,999 | 523,448 | $1,266,756 | 1.71% | $2,420 | $308.16 | 75% |
| 90,000 | to | 99,999 | 444,525 | $1,321,065 | 1.78% | $2,972 | $378.43 | 78% |
| 100,000 | to | 149,999 | 1,344,009 | $6,527,053 | 8.81% | $4,856 | $618.40 | 86% |
| 150,000 | to | 199,999 | 636,171 | $5,566,060 | 7.52% | $8,749 | $1,114.12 | 90% |
| 200,000 | to | 299,999 | 473,588 | $6,834,617 | 9.23% | $14,432 | $1,837.68 | 92% |
| 300,000 | to | 399,999 | 170,913 | $4,015,092 | 5.42% | $23,492 | $2,991.42 | 93% |
| 400,000 | to | 499,999 | 81,703 | $2,706,437 | 3.65% | $33,125 | $4,218.10 | 94% |
| 500,000 | to | 999,999 | 120,235 | $6,708,679 | 9.06% | $55,796 | $7,104.98 | 95% |
| 1,000,000 | and over | 65,695 | $25,919,343 | 35.00% | $394,541 | $50,239.86 | 95% | |
| Corporations | 828,080 | $8,593,087 | 11.60% | $10,377 | $1,321.40 | 100% | ||
| Totals / Averages | 16,684,099 | $74,051,983 | 100.00% | $4,438 | $565.19 | |||
Income classes based on all tax returns, which include individual returns, joint (family) returns, partnerships and Subchapter S corporations.
One benefit of using the income tax, which is progressive, is that every California student can attend tuition-free without giving wealthier families a free ride. High-income households pay more to restore the Master Plan, just as they pay more to fund other public priorities—because they derive an even larger benefit from an expanding economy. Using the income tax solves a problem with California’s current “high-fee, high-aid” higher education model, which requires arduous fee-waiver applications from lower-income families and hits higher-income families twice: once at tax time and again in prices for public services the taxes are supposed to provide. A better solution would be to charge the wealthy (and everyone else) once, through the income tax, and then to provide tuition-free education for all Californians.
Personal and corporate income taxes bring in nearly 75 percent of all state revenue.62 Allocating a portion of the cost to other taxes would dilute the effect on individual taxpayers. The scenarios above also assume that the costs will be distributed as a uniform surcharge across all income tax categories. If the surcharge were allocated more or less progressively, its effect on individual taxpayers would change.
Other financing options
An income tax can also be combined with other revenue sources.
Re-purposing Cal Grant funds | In 2016-17, California will also spend $2.27 billion on Cal Grant student aid. If higher education were tuition-free, Cal Grant appropriations could be returned to the General Fund or be rolled into the project of supporting higher education, defraying nearly one-quarter of the $9.43 billion total cost. Our recommendation is to apply the aid budget directly to the unmet survival costs of low-income students. Housing, insurance and other basic living costs are helping fuel student debt. The current state aid system is now almost entirely directed at tuition payments, while the majority of students’ costs for attending public colleges and universities are survival costs.
Prop 13 reform | Prop 13, a 1978 amendment to the state constitution, made far- reaching changes to how and when California real estate is taxed.
Reformers have argued that applying the same taxation rules to commercial real estate as to residential real estate distorts the market. They also observe that commercial property owners can create complex ownership entities to avoid reassessments when they sell. Reformers have proposed to maintain protections for homeowners, renters and agricultural landowners, but to reassess commercial property, at near-market value, annually. It has been estimated that this change would raise $9 billion more per year.63
Revenue generated by Proposition 13 reform would go to local government entities to pay for a variety of local government services, including services the state general fund currently spends tens of billions of dollars to cover. Proposition 13 reform could potentially free up this state general fund money for other purposes, such as restoring the Master Plan.
Estate tax | Eighteen states have an estate or inheritance tax. California does not. If California were to adopt an estate tax, setting the exemption at the federal level of $5.45 million, it would generate an estimated $950 million annually, 10 percent of the cost to restore the Master Plan. Setting the exemption at $1 million, as Massachusetts, Oregon and the District of Columbia do, would raise an estimated $1.74 billion: 18 percent of the cost.64 (See Table 3)
Oil severance tax | In 2013, SB 241 proposed an oil extraction tax, the proceeds of which would have largely gone toward California public higher education.
The Board of Equalization estimated that the measure, which proposed to tax oil at 9.5 percent of its value and natural gas at 3.5 percent (compared to Texas rates of 7.5 percent and 4.6 percent),65 would have generated $1.5 billion in 2014-15: 16 percent of today’s cost to restore the Master Plan (Table 3).
Financial transactions tax (federal) | If Congress imposed taxes on sales of stocks, bonds, derivatives and other instruments, it might generate between $110 billion and $400 billion annually.66 Allocated to California on a per capita basis, the state’s share would be between $9 and $32 billion—more than enough to cover restoring the Master Plan.
Reallocate state budget savings | Prison reform or prescription drug reform could free up resources for higher education. For example, the current budget estimates that Prop 47’s sentencing reforms saved the state about $29 million in 2015, savings not directed at higher education. Advocates of prescription drug reform, of the scale proposed on the November 2016 ballot, estimate it would save the state $330-780 million per year.67
Mix and match of funding sources
Funding alternatives listed above can be used to reduce the contribution from a state income to cover restoration of the Master Plan. Doing so would reduce the income tax increment.
| Income tax only | $48 | $1,114 | $50,240 |
| + Estate tax (fed. exclusion) | $43 | $1,002 | $45,178 |
| + Oil severance tax | $40 | $937 | $42,248 |
| All three revenue sources | $36 | $825 | $37,187 |
Conclusion
California’s two-decade experiment in privatizing higher education has failed, as it has failed in the rest of the country. Top-quality, accessible and appropriate higher education that affords opportunity to all California students has been replaced with a system that restricts access, costs students more and compromises educational quality. Exploding student debt constricts students’ futures and harms the economy as a whole.
It is entirely feasible to reinstate California’s proven success in public higher education. Several reasonable funding options can be mixed and matched to make the costs remarkably low for almost all California families.
Our state has the means and the opportunity. Will we recover our political will and vision?
Notes and references
- For an example from the Republican side, see Tennessee Gov. Bill Haslam’s “Tennessee Promise,” offering two years of free community college. Democrats making proposals have included President Barack Obama (2015), Hilary Clinton (2015) and Bernie Sanders (2016).
- Legislative Analyst’s Office (2016) EdBudget Tables. In 2016-17, California will spend $10,605 per K-12 student, under Prop 98, and $7,277 per FTE higher education student, including student aid, from the general fund. http://www.lao.ca.gov/PolicyAreas/ education/EdBudget
- Johnson HP, Cuellar Mejia M, Ezekial D, Zeiger B (2013) Student debt and the value of a college degree. Public Policy Institute of California. June 2013. http://www.ppic.org/content/pubs/report/R_613HJR.pdf
- The Master Plan Survey Team (1960) A Master Plan for Higher Education in California, 1960-1975. California State Dept. of Education, Sacramento. http://www.ucop.edu/acadinit/mastplan/MasterPlan1960.pdf
- National Center for Education Statistics (2016) Fast facts: Graduation rates. “Among first-time, full-time undergraduate students who began seeking a bachelor’s degree at a 4-year degree-granting institution in fall 2007, the 6-year graduation rate was 58 percent at public institutions, 65 percent at private nonprofit institutions, and 32 percent at private for-profit institutions.” https:// nces.ed.gov/fastfacts/display.asp?id=40
- Baldassare M, Bonner D, Kordus D, Lopes Lunna (2016) PPIC Statewide survey Californians and higher education. Public Policy Institute of California. December 2016. http://www.ppic.org/main/publication.asp?i=1223
- Johnson HP, Cuellar Mejia M, Bohn S (2015) Will California run out of college graduates? Public Policy Institute of California. http:// ppic.org/main/publication_quick.asp?i=1166
- This estimate assumes that the cost will be covered by an income tax surcharge. Other revenue sources can be used, but an advantage of an income tax surcharge is that higher-income households would pay a progressively larger share. In this scenario, one-third of California households would pay less than $10 a year; two-thirds of state households would pay less than $180 a year; households in the top 5 percent of income brackets would pay $7,100 or Distribution among tax brackets is detailed in Table 2.
- University of California (2015) Accountability report 2015. Chapter 2: Undergraduate students—Affordability. See measure 5: Student response to a UCUES survey. http://accountability.universityofcalifornia.edu/2015/chapters/chapter-2.html
- Watanabe T, Newell Four in 10 UC students do not have a consistent source of high-quality, nutritious food, survey says. The Los Angeles Times, 13 July 2016. http://www.latimes.com/local/california/la-me-uc-food-insecurity-07112016-snap-story.html
- Weekend Edition Sunday (26 June 2016) 1 in 10 Cal State students is homeless, study finds. http://www.latimes.com/local/ lanow/la-me-cal-state-homelessness-20160620-snap-story.html
- Work hours per week equal CSU tuition and fees in 2000 and 2016, each divided by 36 academic weeks, with results divided by the minimum hourly wages in 2000 and 2016 (all in nominal dollars).
- Perna LW (2010) Understanding the working college student. AAUP, 2010. https://aaup.org/article/understanding- working-college-student#.WIEya7GZPOY
- $57.5 billion is the sum of the differences, adjusted for inflaton, between general fund dollars allocated per FTE student in each public education segment in the 2000 base year and funds-per-FTE allocated in each subsequent year, multiplied by the number of FTE students each year, from 2001 to 2016. If UC had been funded at 2000 levels through 2016, it would have seen $40.5 billion more; CSU $16.6 billion more; and CCC $315 million Data sources: General fund dollars: LAO; FTE students: Segment data.
- McMahon WW. Higher learning, greater good: The private and social benefits of higher education. Baltimore: Johns Hopkins University Press,
- The calculations in this report do not assume that any new federal funds are available. If they were, of course, the marginal costs to California households would be proportionately lower than estimated in this analysis.
- National Center for Higher Education Management Systems (2005) As America becomes more diverse: The impact of state higher education inequality—California state profile.
- Finney JE, Riso C, Orosz K, Boland WC (2014) From Master Plan to mediocrity: Higher education performance & policy in California. Philadelphia: Institute for Research on Higher Education, Graduate School of Education, University of Pennsylvania, 2014, page 5. http://www.gse.upenn.edu/pdf/irhe/California_Report.pdf
- Johnson HP, Reed D (2007) Can California import enough college graduates to meet workforce needs? Public Policy Institute of California. http://www.ppic.org/main/publication.asp?i=750
- Baldassare M, Hanak E (2005) California 2025: It’s your choice. Public Policy Institute of California. http://www.ppic.org/main/asp?i=600
- Johnson HP, Cuellar Mejia M, Bohn S (2015)
- Enrollment in California’s public higher education system peaked in 2009-10 at 9 million full time equivalent students, a number reattained only in 2016-17. Over those years, inflation-adjusted tuition and fees climbed 58 percent at the Community Colleges, 26 percent at CSU and 22 percent at UC.
- Finney et al. (2014) at pages 10-11
- California Community Colleges, Chancellor’s Office (2016) California community colleges key facts. http:// cccco.edu/policyinaction/keyfacts.aspx
- Finney et al. (2014) at page 13
- CCC Chancellor Brice Harris, cited in: Newfield How public research universities are losing the framing wars. Remaking the University (blog). 14 February 2013. http://utotherescue.blogspot.com/2013/02/how-public-research-universities-are.html
- Shulock N, Moore C, Tan C (2014) A new vision for California higher education: A model public agenda. Sacramento: Sacramento State Institute for Higher Education Leadership and Policy, page 4. http://collegecampaign.org/wp-content/uploads/2014/06/R_pdf
- Shulock et al. (2014) at Figure 2
- Finney et al. (2014) at page 28
- Shulock et al. (2014) at page 15
- Shulock at al. (2014) at page 16
- Providers of online course technologies may have exaggerated their economies to win contracts. See: Newfield Where are the savings? Inside Higher Ed, 24 June 2013. https://www.insidehighered.com/views/2013/06/24/essay-sees-missing-savings-georgia- techs-much-discussed-mooc-based-program. Little financial disclosure has occurred in the three years following; for example, see: Straumsheim C. Georgia Tech plans next steps for online master’s degree in computer science. Inside Higher Ed, 27 April 2016. https://www.insidehighered.com/news/2016/04/27/georgia-tech-plans-next-steps-online-masters-degree-computer-science
- Shulock et al. (2014) at page 17
- Johnson HP, Li Q (2010) Higher education in California: New goals for the Master Plan. Public Policy Institute of California. (PPIC, 2010). http://www.ppic.org/main/publication.asp?i=916
- Johnson et al. (2010) at page
- Public Policy Institute of California (2016). Higher education in California. http://www.ppic.org/main/publication.asp?i=1179
- Brown P, Lauder H, Ashton D. The global auction: The broken promises of education, jobs, and incomes. New York: Oxford University Press,
- UC Office of the President. Budget for Current Operations 2014-15 at S-4). http://regents.universityofcalifornia.edu/regmeet/ nov13/f6attach.pdf
- Combined education fee and registration fee income reported by UC in its Budget for current operations 2001-02 http://www.edu/operating-budget/_files/rbudget/2001-02budgetforcurrentoperations.pdf. And Budget for current operations 2015-16. http://www.ucop.edu/operating-budget/_files/rbudget/2015-16budgetforcurrentoperations_.pdf
- UC calculates that “the average expenditure per student for a UC education has declined by 13% over 24 years— from $22,390 in 1990-91 to $19,590 in 2013-14” (UC Office of the President, Budget for Current Operations 2014-15 at S-11).
- Brostrom et al. (2012). 2012-13 state budget overview and UC budget update. UC Office of the President. 19 January 2012. http:// ucop.edu/operating-budget/_files/documents/2011-12/budgetoverview2012-13.pdf
- See: California Community Colleges, Chancellor’s Office. Student success scorecard: 2015 state of the system report. http:// cccco.edu/Portals/0/Reports/2015-State-of-the-System-Report-ADA-Web.pdf. And: CSU analytic studies. http://www.calstate.edu/AS/
- Complete College America (2012) Remediation: Higher education’s bridge to nowhere. https://insidehighered.com/sites/ default/server_files/files/CCA%20Remediation%20ES%20FINAL.pdf
- National Center for Education Statistics (1994) Undergraduates who work while enrolled in postsecondary education: 1989-90. https://nces.ed.gov/pubs94/94311.pdf
- See: Blanchard LJ, Gold J (2016) California State University graduation initiative 2025. https://www2.calstate.edu/graduation- initiative-2025
- California Faculty Association. Background on mandatory early start. http://www.calfac.org/sites/main/files/file-attachments/ pdf. Also: Rhodes G (2012) Closing the door, increasing the gap: Who’s not going to (community) college? Center for the Future of Higher Education Policy. Report #1. https://www.insidehighered.com/sites/default/ server_files/files/ClosingTheDoor_Embargoed.pdf
- Arum R, Roksa Academically adrift: Limited learning on college campuses. Chicago: University of Chicago Press, 2011. Page 108.
- Arum at al (2011).
- Hart Research Associates (2013) It takes more than a major: Employer priorities for college learning and student success. Association of American Colleges & Universities. 10 April 2013. https://aacu.org/publications-research/periodicals/it-takes- more-major-employer-priorities-college-learning-and
- Brown PC, Roediger (III) HL, McDaniel Make it stick: The science of successful learning. Cambridge, Massachusetts: Belknap Press, 2014, Chapter 3.
- Piore MJ, Sabel The second industrial divide: Possibilities for prosperity. New York: Basic Books, 1984.
- Merton “The Normative Structure of Science,” in The Sociology of Science: Theoretical and Empirical Investigations. Chicago: University of Chicago Press, 1973.
- Kolowich The water next time: Professor who helped expose crisis in Flint says public science is broken. The Chronicle of Higher Education. 2 February 2016. http://www.chronicle.com/article/The-Water-Next-Time-Professor/235136/
- University of California (2015)
- For an overview, see: Newfield How can public research universities pay for research? Remaking the University (blog), 5 August 2014. http://utotherescue.blogspot.com/2014/08/how-can-public-research-universities.html
- The dangerous wealth of the Ivy League. Bloomberg.com. 28 November https://www.bloomberg.com/news/ articles/2007-11-28/the-dangerous-wealth-of-the-ivy-league
- Competitive Graduate Student Financial Support Advisory Committee (2006) Final committee report and recommendations to the Provost. http://www.ucop.edu/student-affairs/_files/gradcommittee2006.pdf
- The Organic Act—Chapter 244 of the Statutes of 1867-1868, Section 14. Rates of Tuition. http://content.cdlib.org/ view?docId=hb6w100756;NAAN=13030&doc.view=frames&chunk.id=div00015&toc.id=div00001&brand=calisphere
- The Master Plan Survey Team (1960) at page 14. “The two governing boards reaffirm the long established principle that state colleges and the University of California shall be tuition free to all residents of the state.”
- Several factors will determine this proposal’s effects on the current federal Pell grant. Tuition is a small part of the total cost-to- attend in the Pell calculation. Because the maximum Pell grant is less than the average cost to attend, many families would still be eligible for maximum Pell grants. Those families no longer eligible for the same grant level, if tuition were eliminated, would often save more through the elimination of tuition than by receiving the larger Pell grant: tuition at CSU and UC is currently larger than the average Pell grant at those
- For state income tax revenue by adjusted gross income (AGI) class and corporate income tax revenue, see State of California Franchise Tax 2015 Annual report—Statistical appendix tables. https://www.ftb.ca.gov/Archive/AboutFTB/Tax_Statistics/ Reports/2015/Annual-Report.shtml
- Governor’s budget revenue estimates 2015-16. http://www.ebudget.ca.gov/2015-16/pdf/BudgetSummary/RevenueEstimates.pdf
- Ito J, Scoggins J, Pastor Manuel (2015) Getting real about reform: Estimating revenue gains from changes to California’s system of assessing commercial real estate. University of Southern California (USC) Program for Environmental and Regional Equity. PERE Rapid Response Projects. http://dornsife.usc.edu/pere/getting-real-about-reform/
- McNichol E (2016) State estate taxes: A key tool for broad prosperity. Center on Budget and Policy Priorities. http://www.cbpp. org/research/state-budget-and-tax/state-estate-taxes-a-key-tool-for-broad-prosperity
- Pless J (2012) Oil and gas severance taxes: States work to alleviate fiscal pressures amid the natural gas boom. National Conference of State Legislatures. http://www.ncsl.org/research/energy/oil-and-gas-severance-taxes
- Bivens J and Blair H (2016) A financial transaction tax would help ensure Wall Street works for Main Street. Economic Policy Institute. http://www.epi.org/publication/a-financial-transaction-tax-would-help-ensure-wall-street-works-for-main-street
- Yes on 61, Californians for Lower Drug Prices. FAQs: What you need to know about the California Drug Price Relief Act. http:// com/faq/